With the changes to Activity Completion, Improved Quality Settings, and introducing the new Focus Tab, this release is packed with exciting updates. So, grab your gear and get ready to hit the slopes as we tell you about the mountain of changes in Aegis Analytics v5.3.
What’s new?
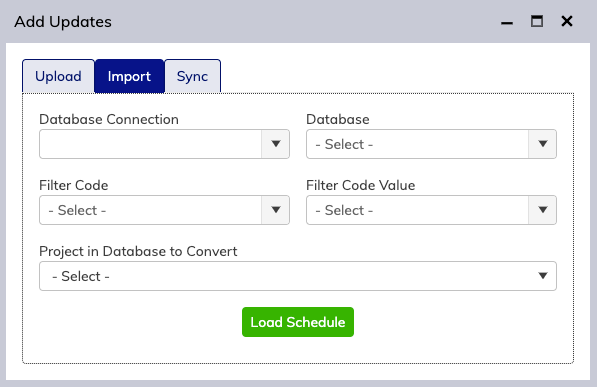
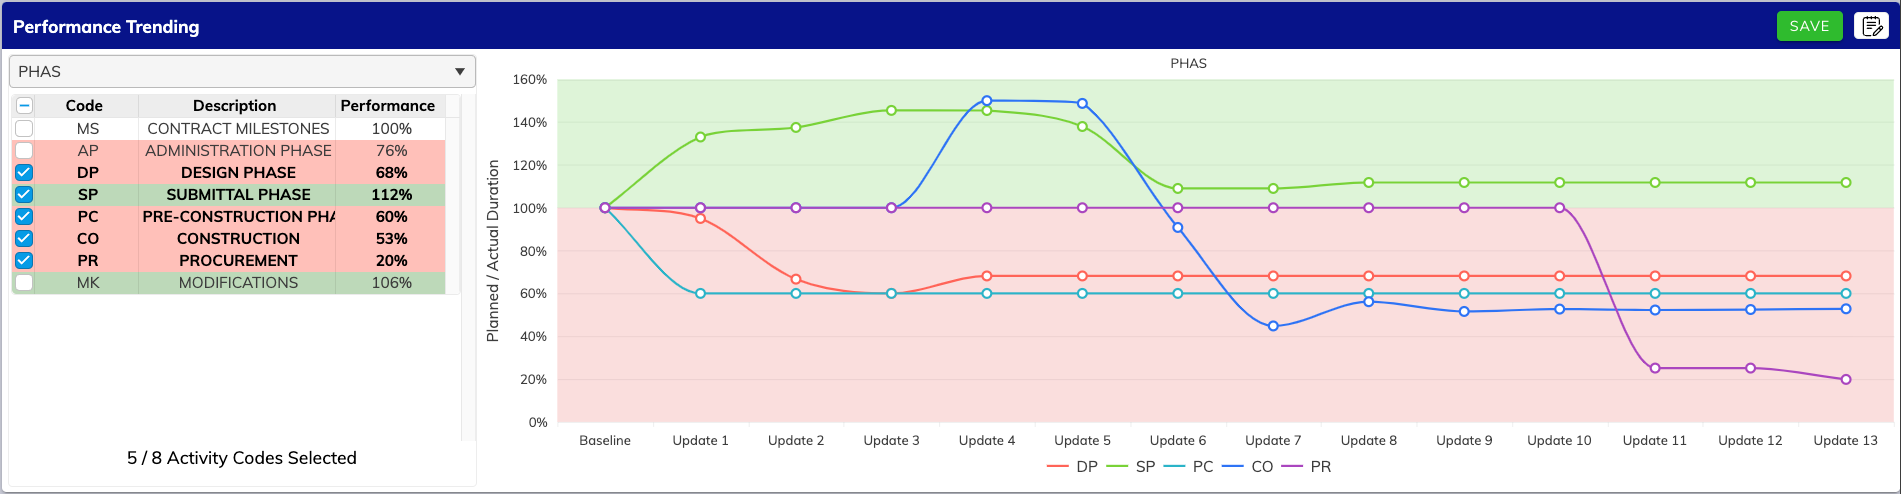
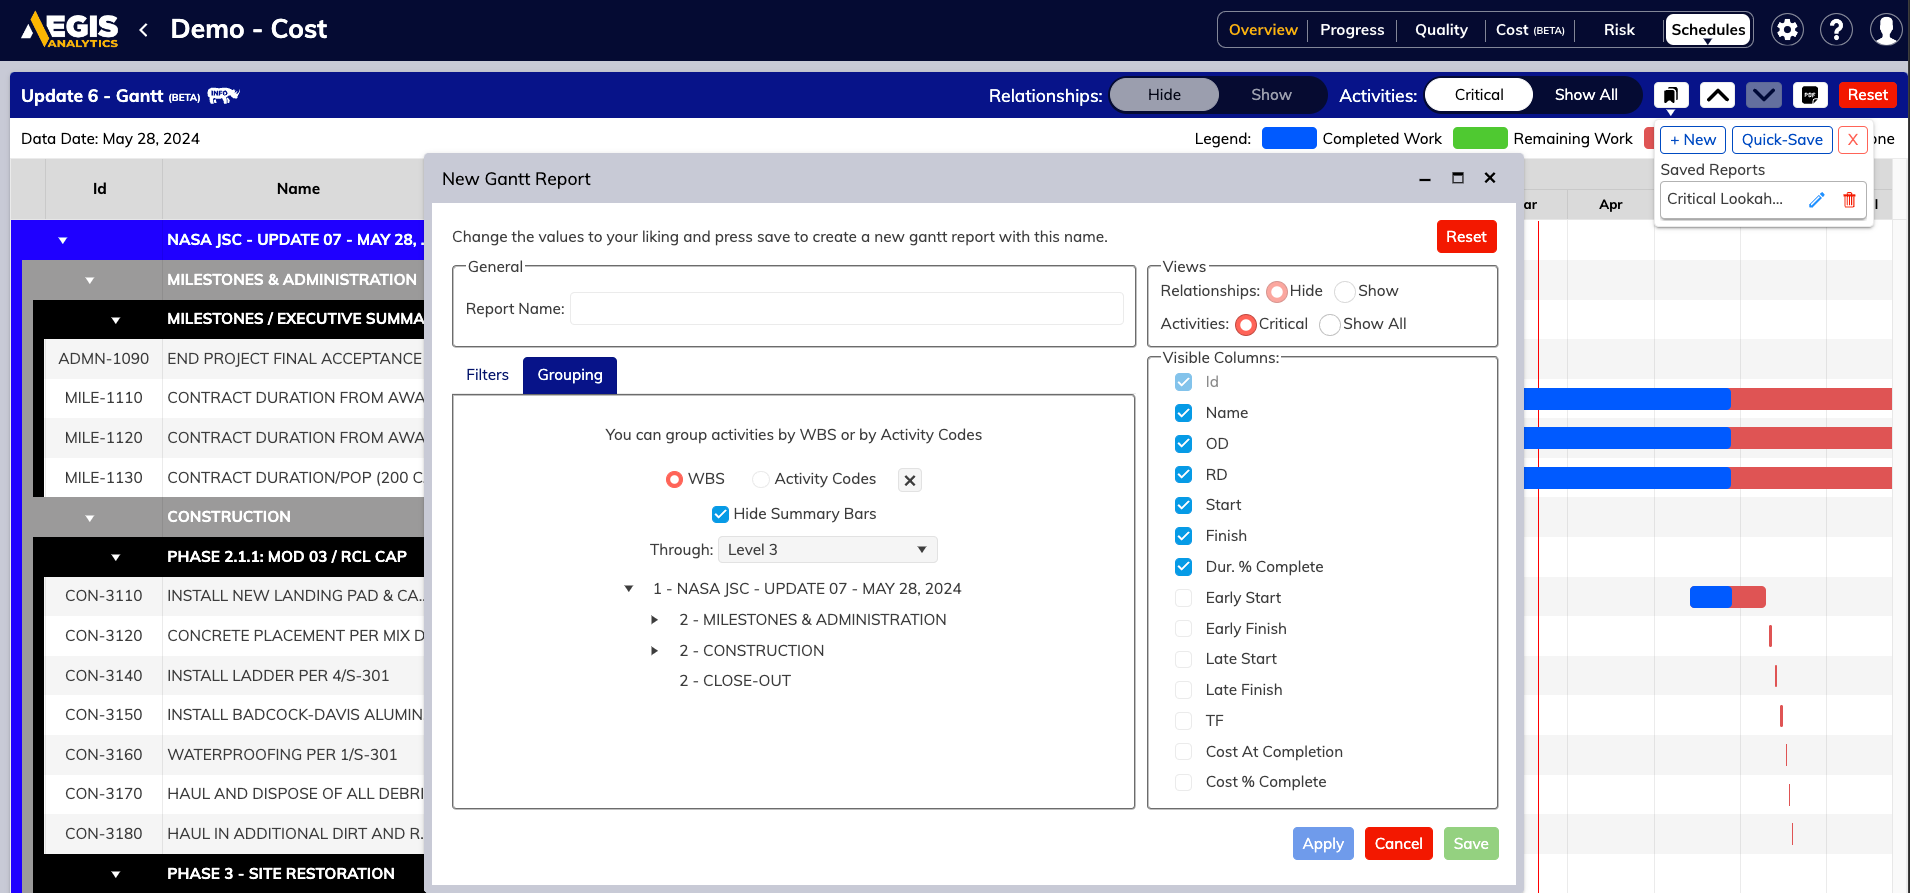
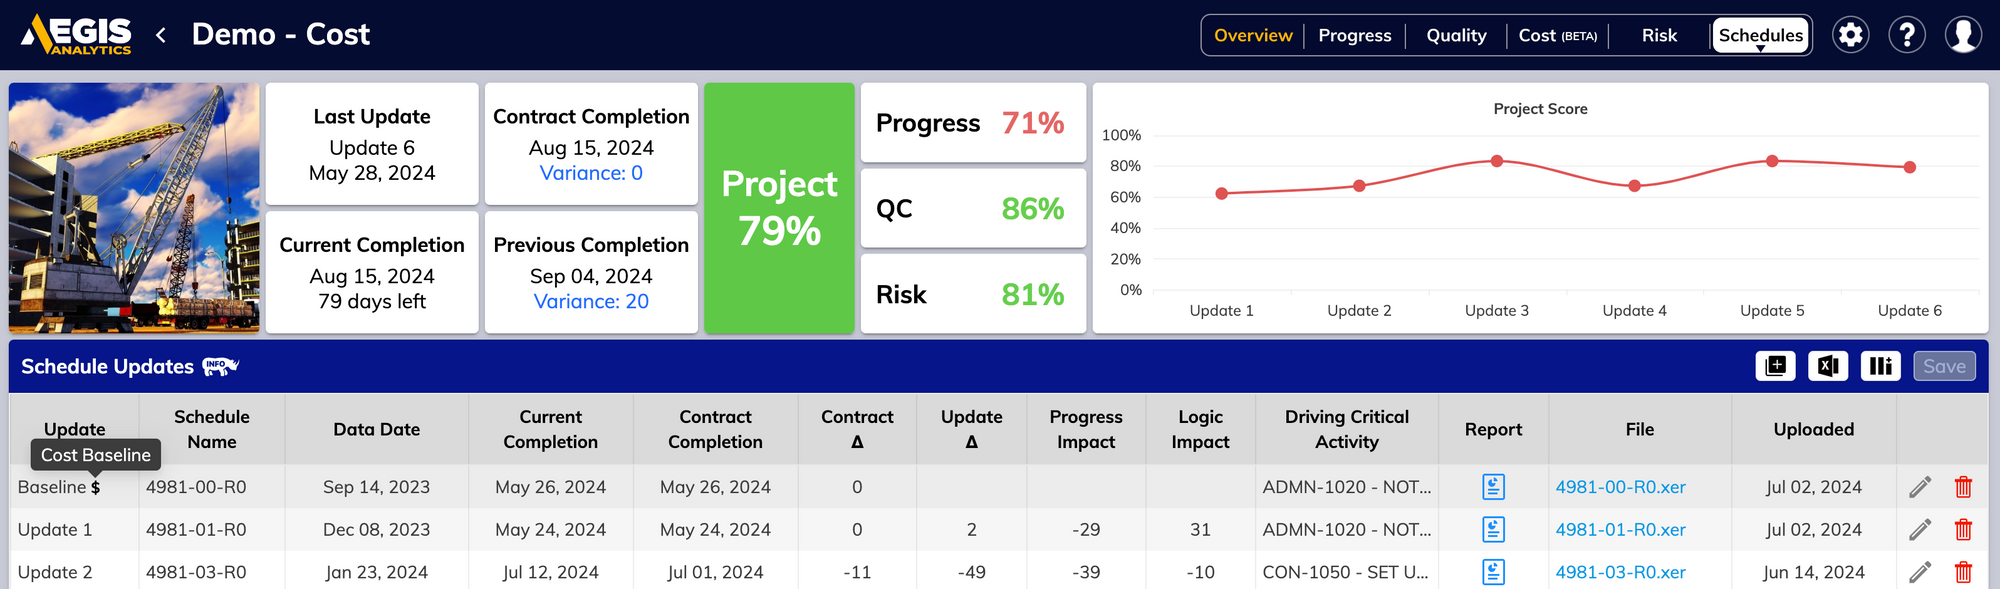
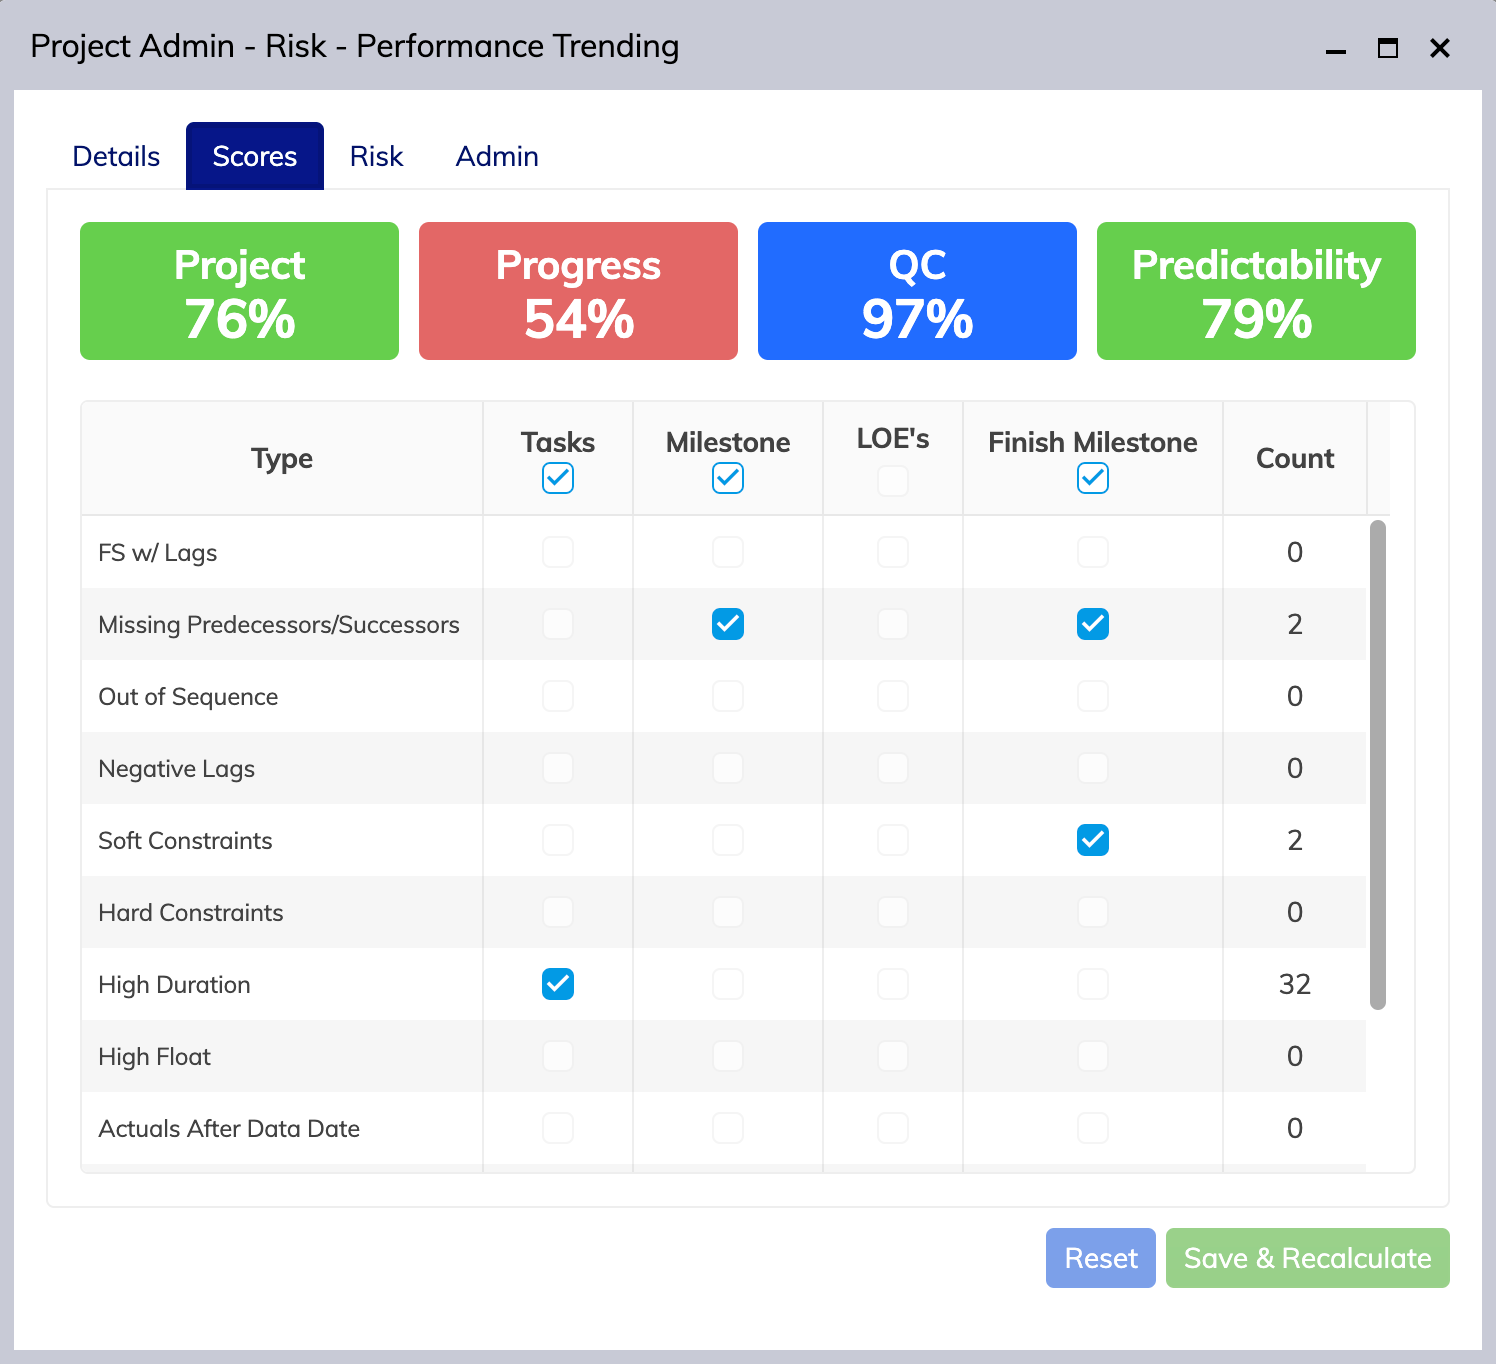
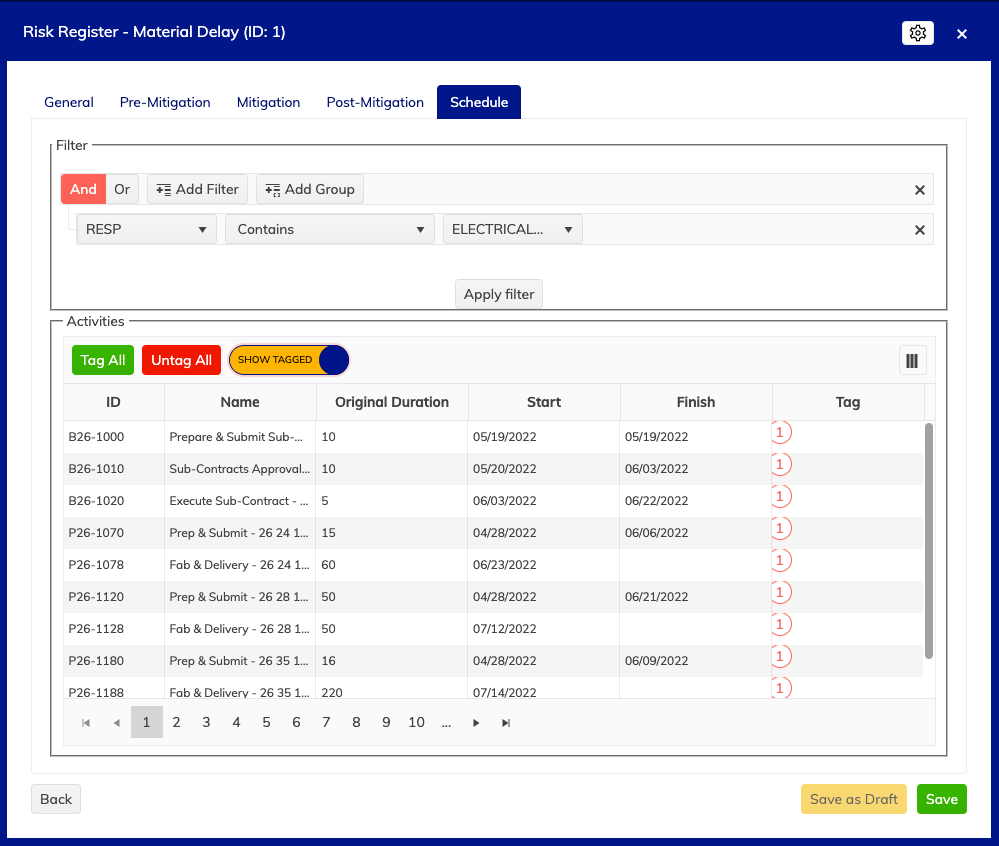
- Added the Focus Tab, which allows you to drill down on specific areas of your schedule and generate reports for specific sections.
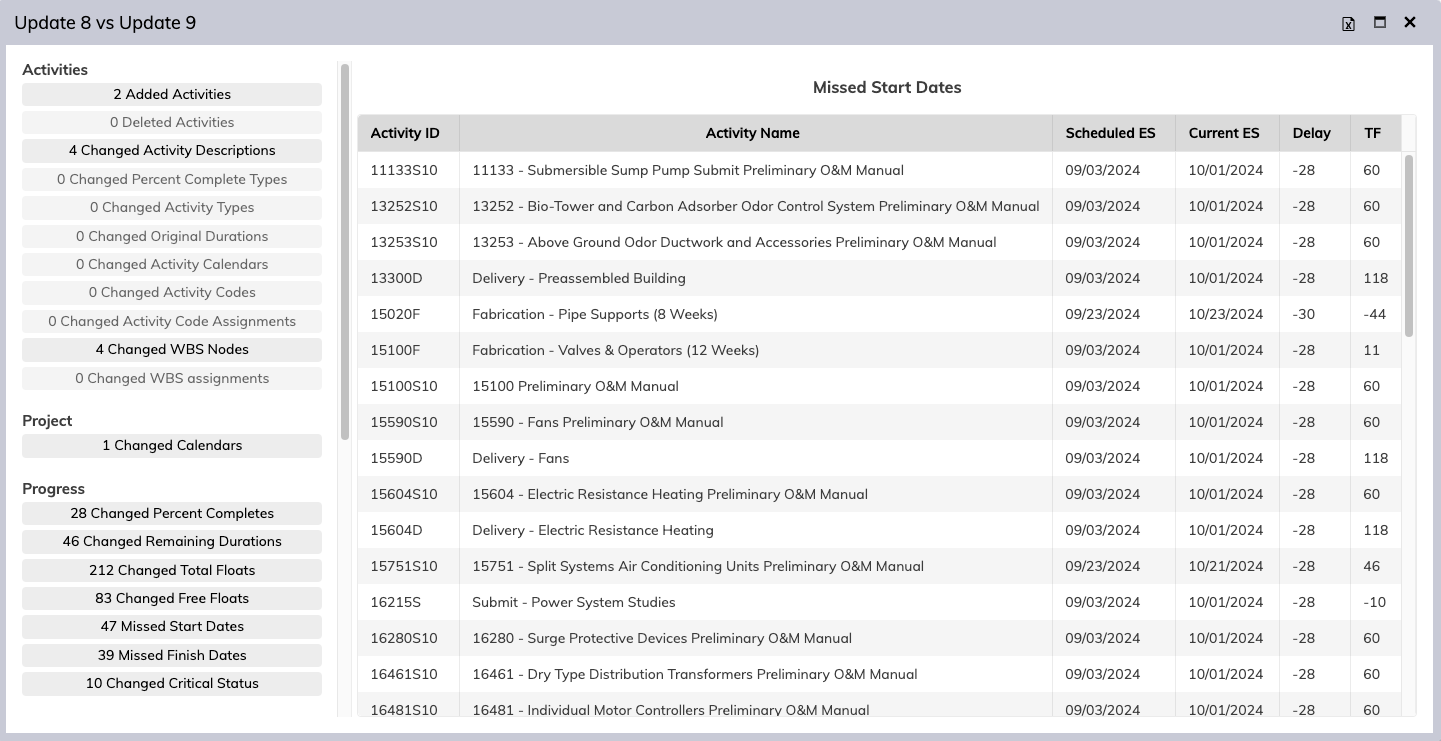
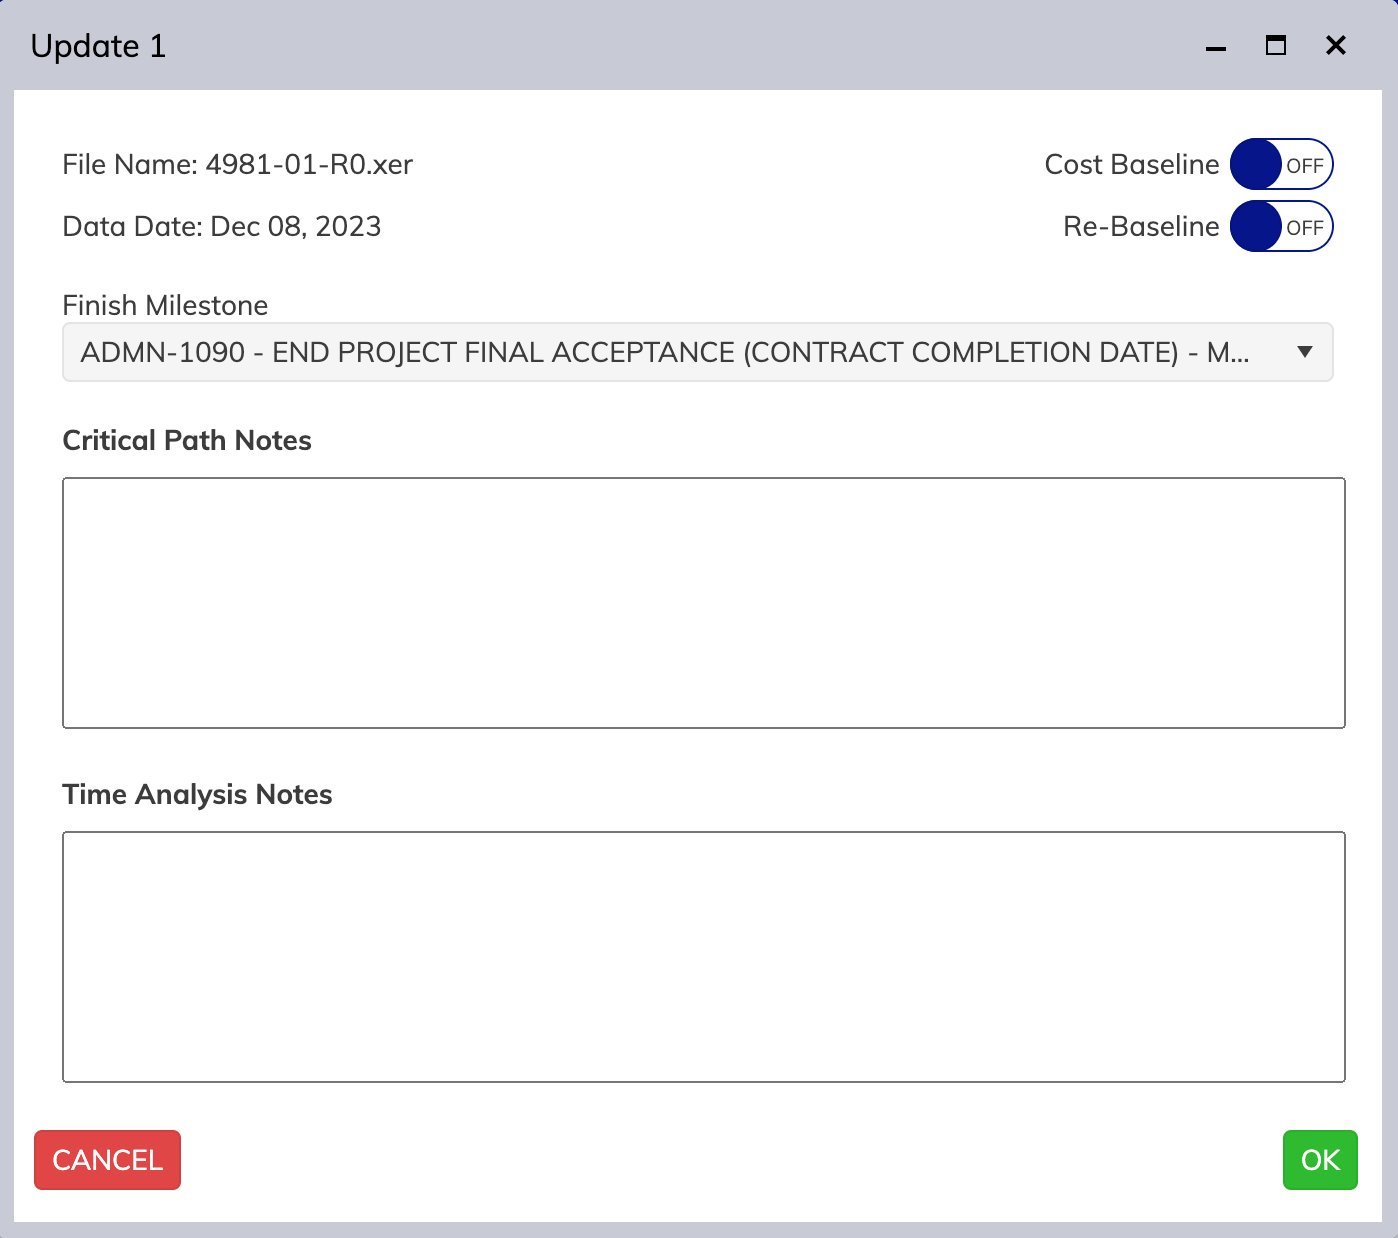
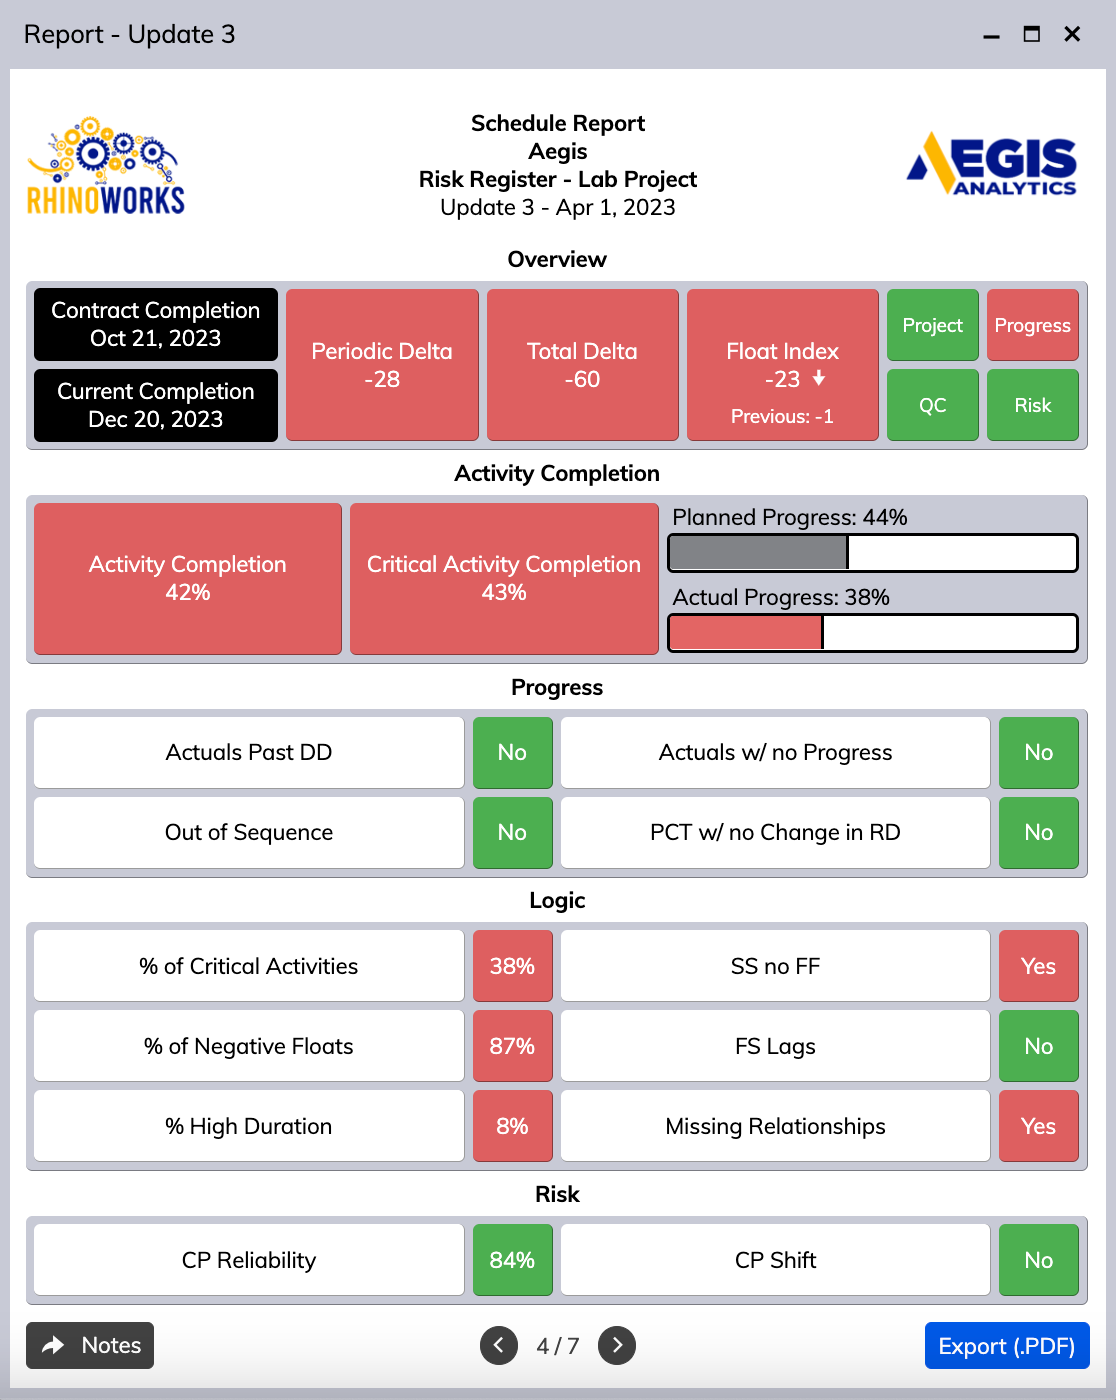
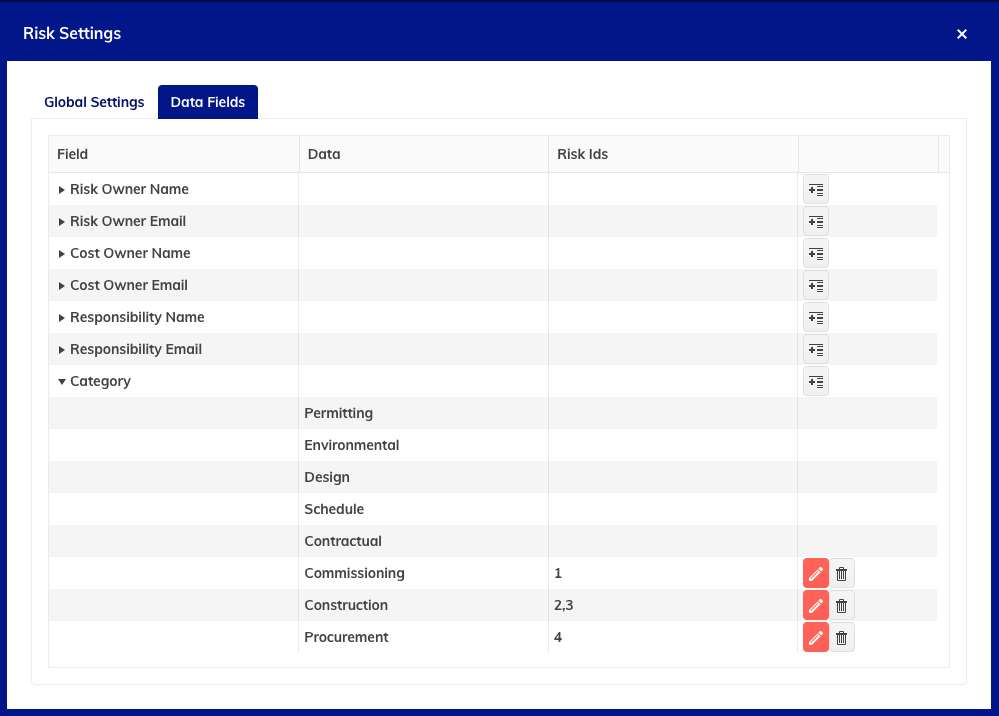
- Quality control settings, including activity code exclusion and custom DCMA tests
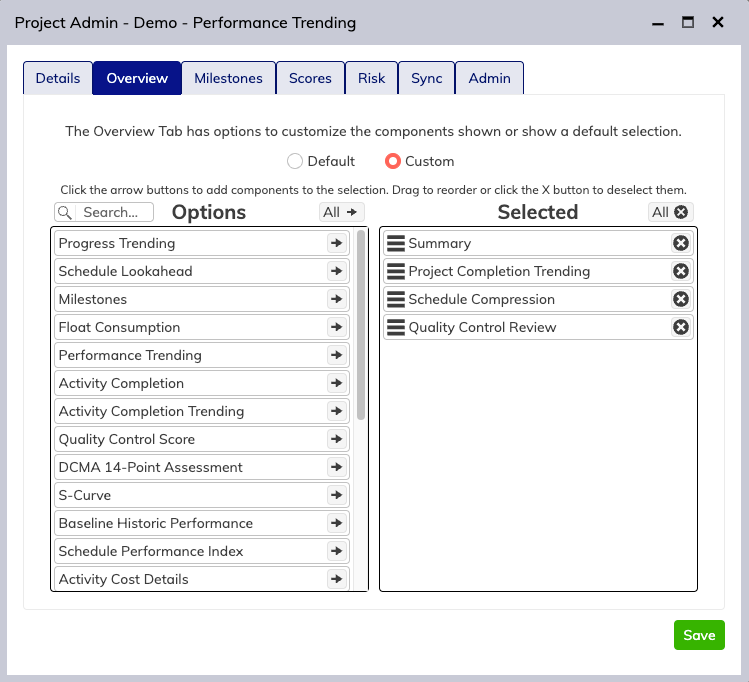
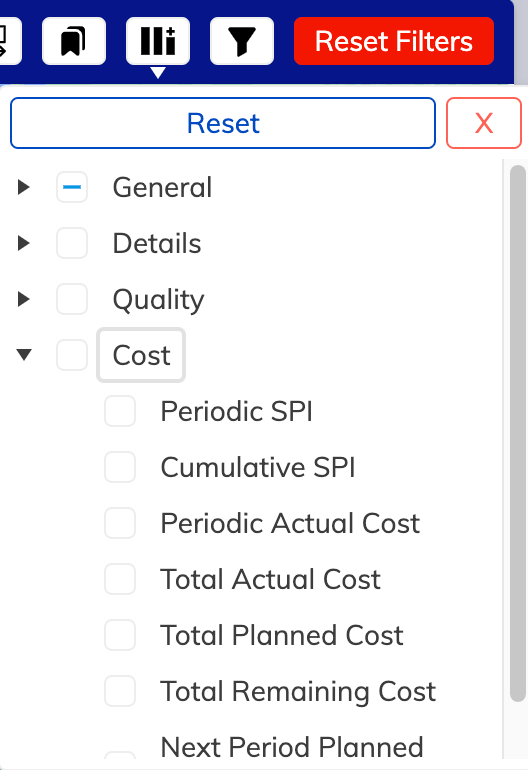
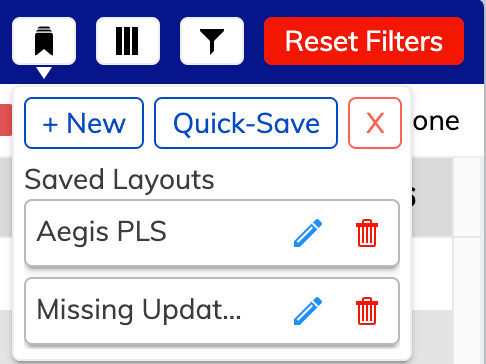
- Tab layout in the Project View is now fully customizable
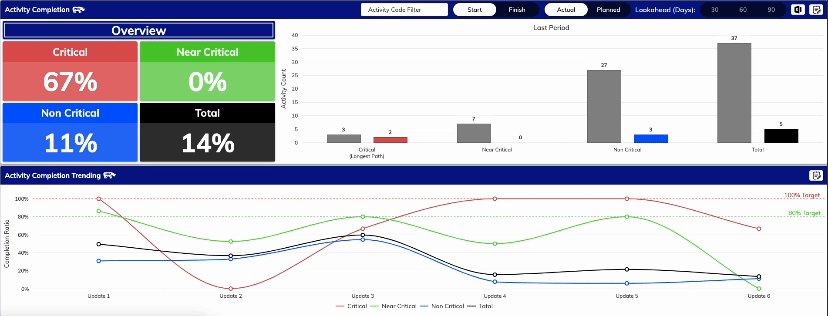
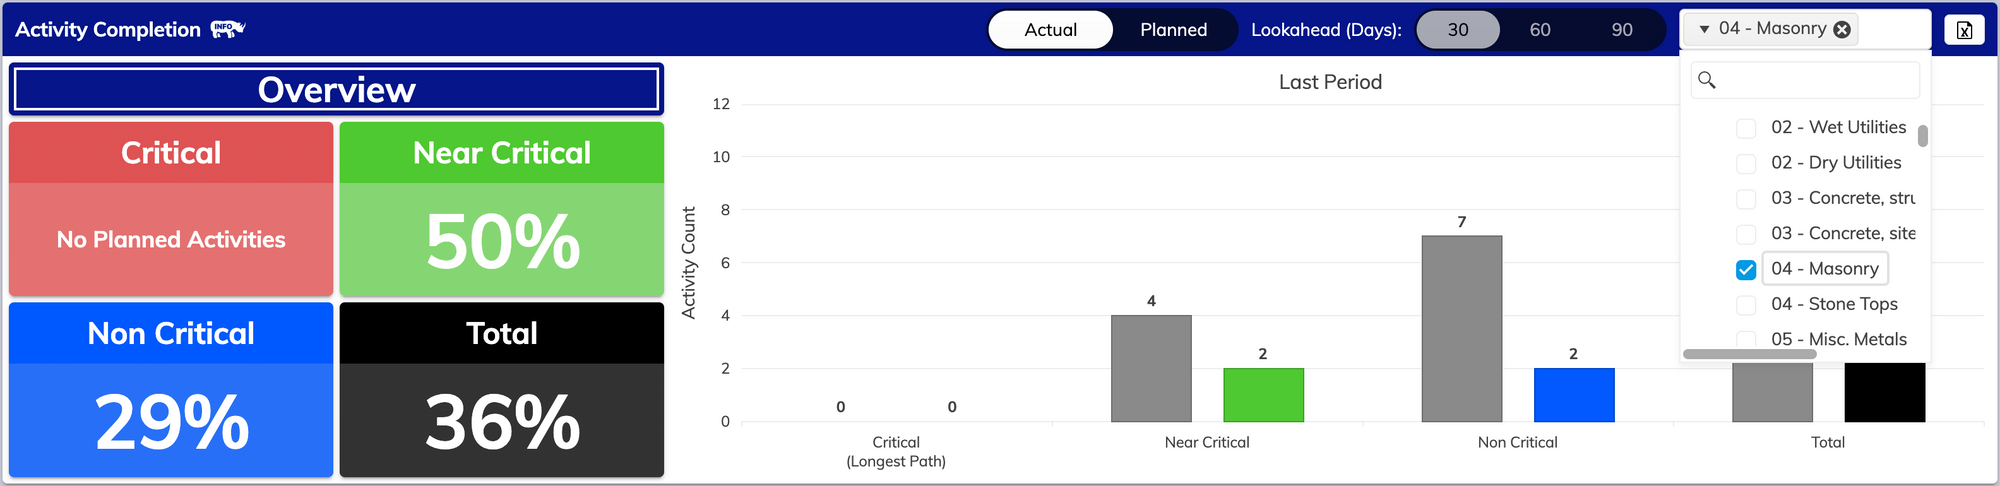
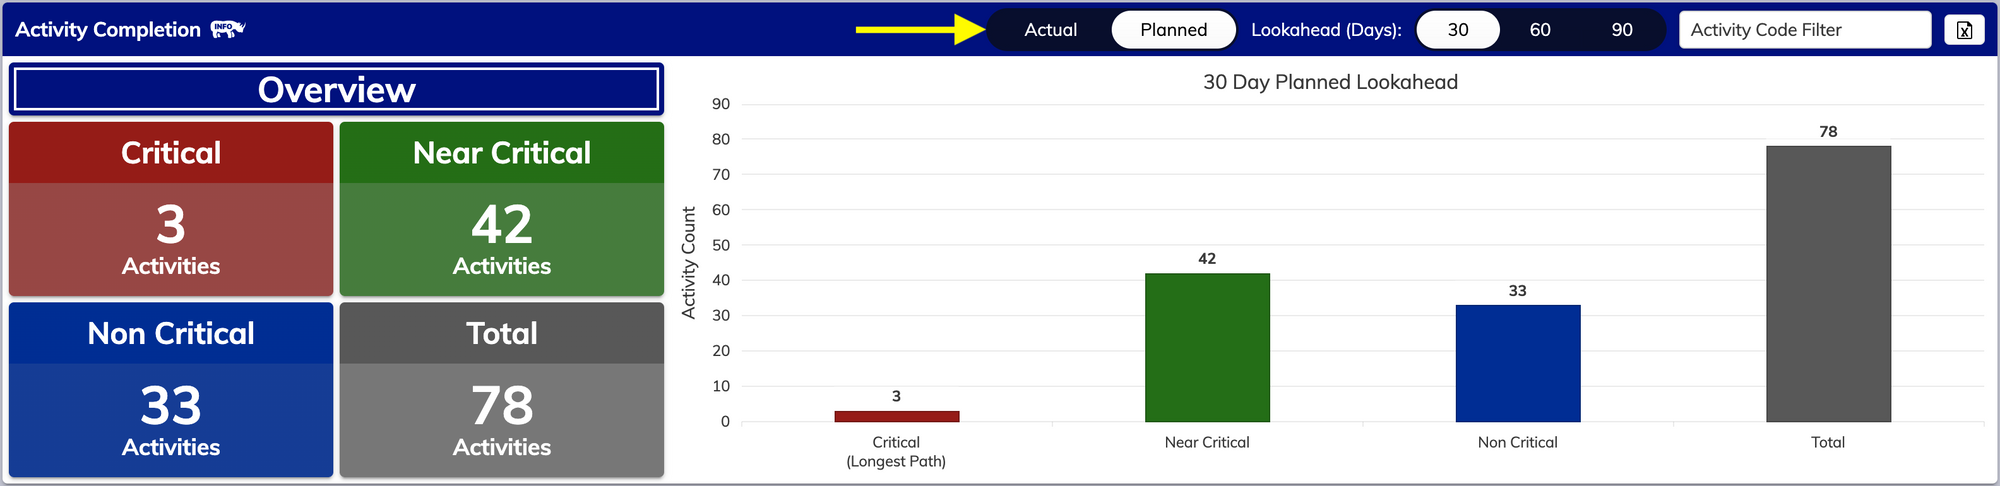
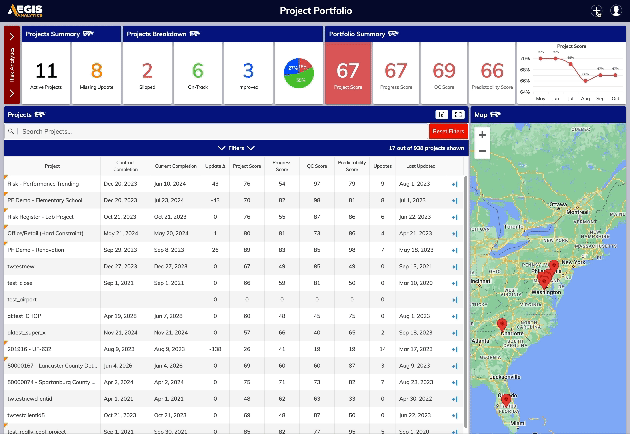
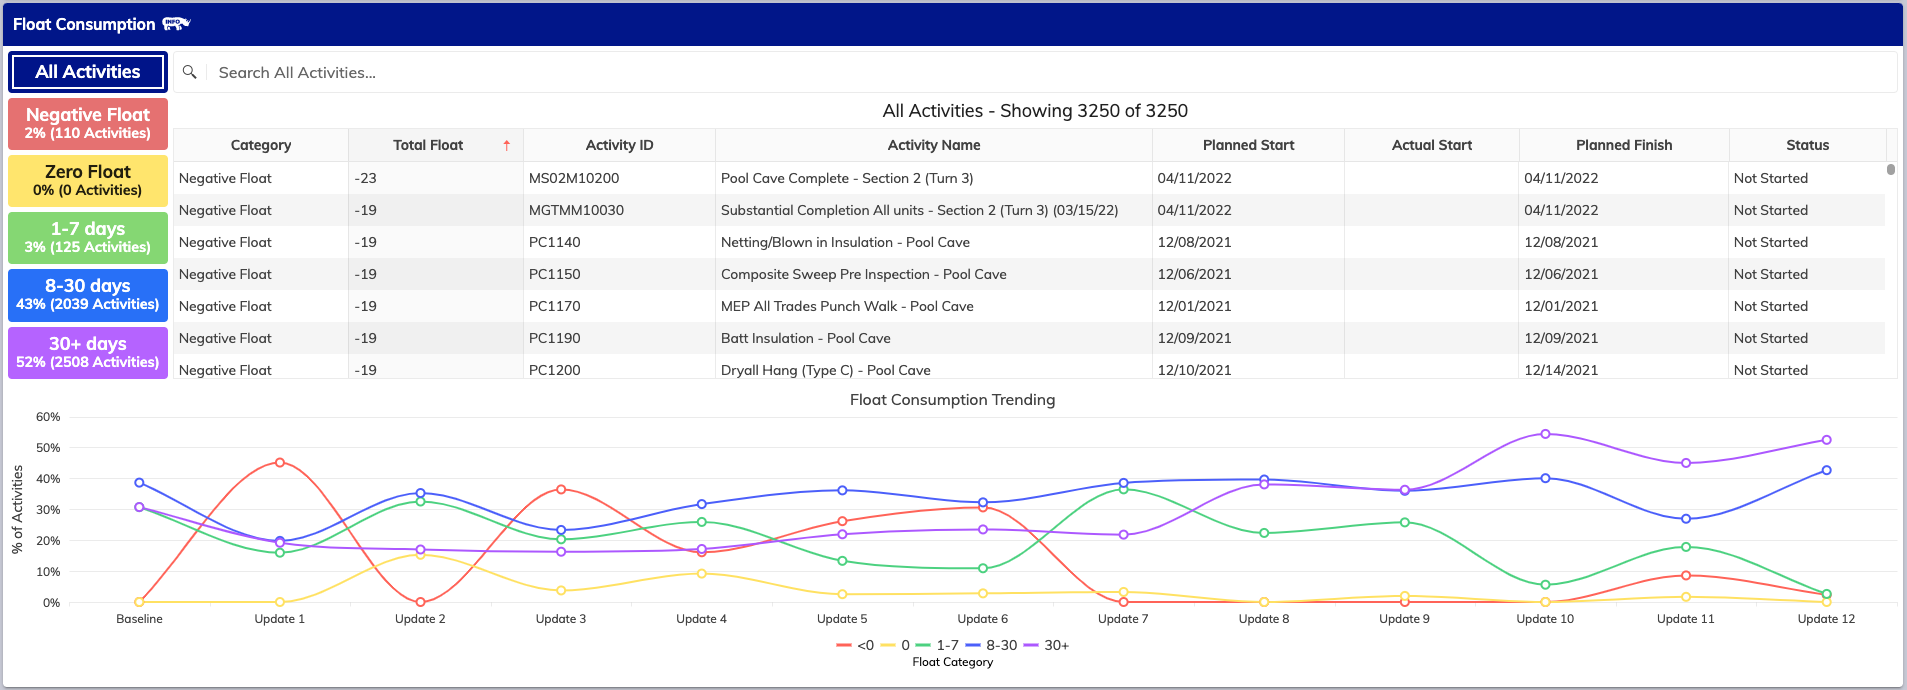
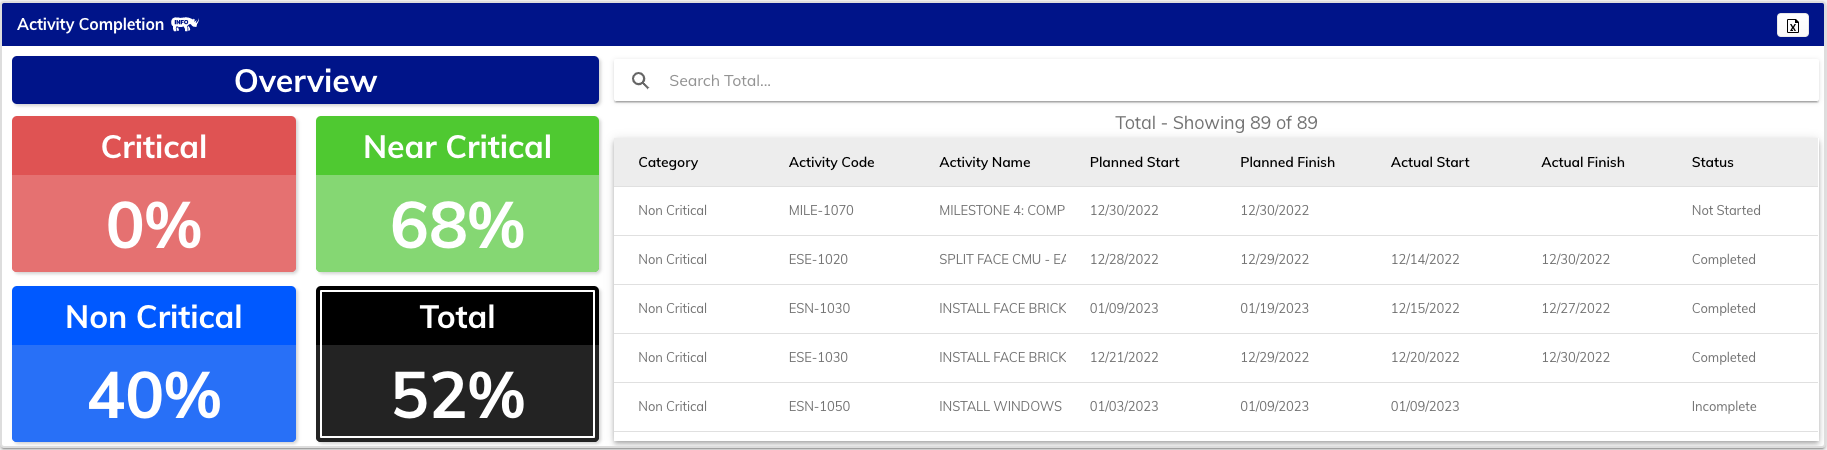
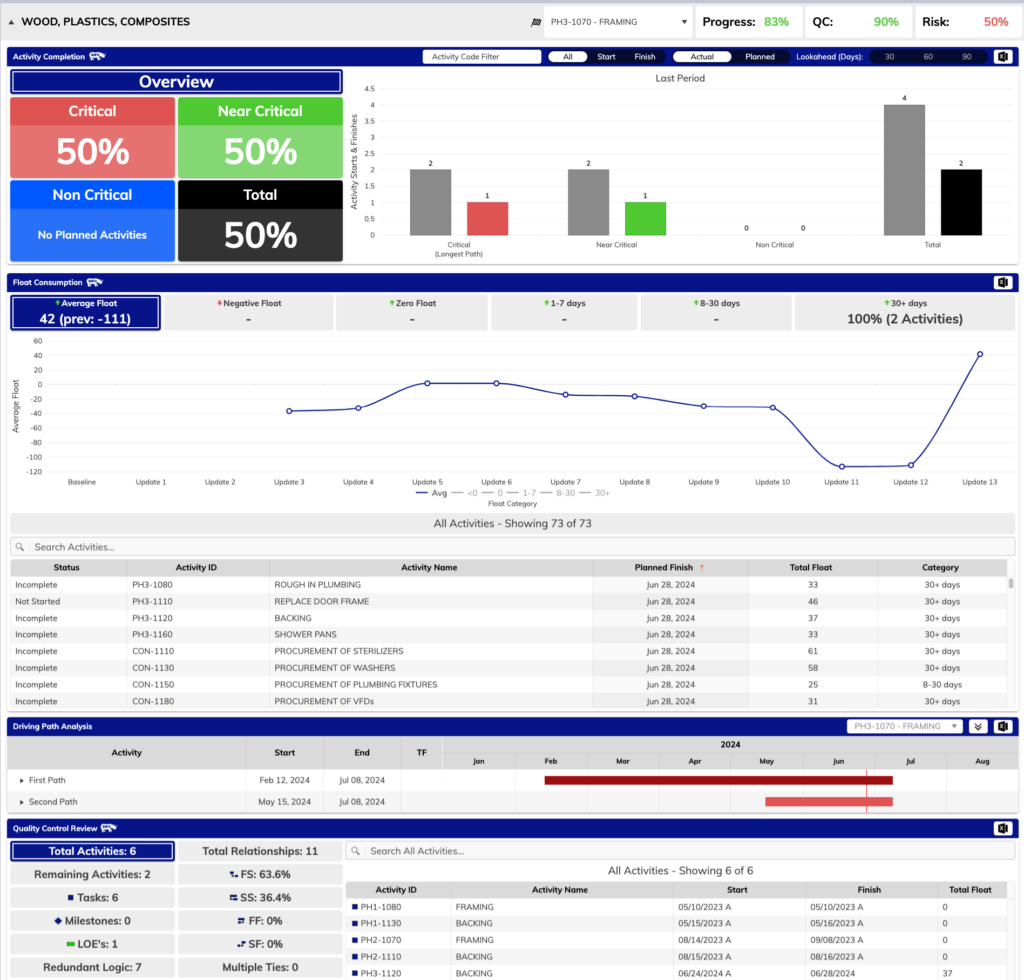
- New “All” view added to the Activity Completion component
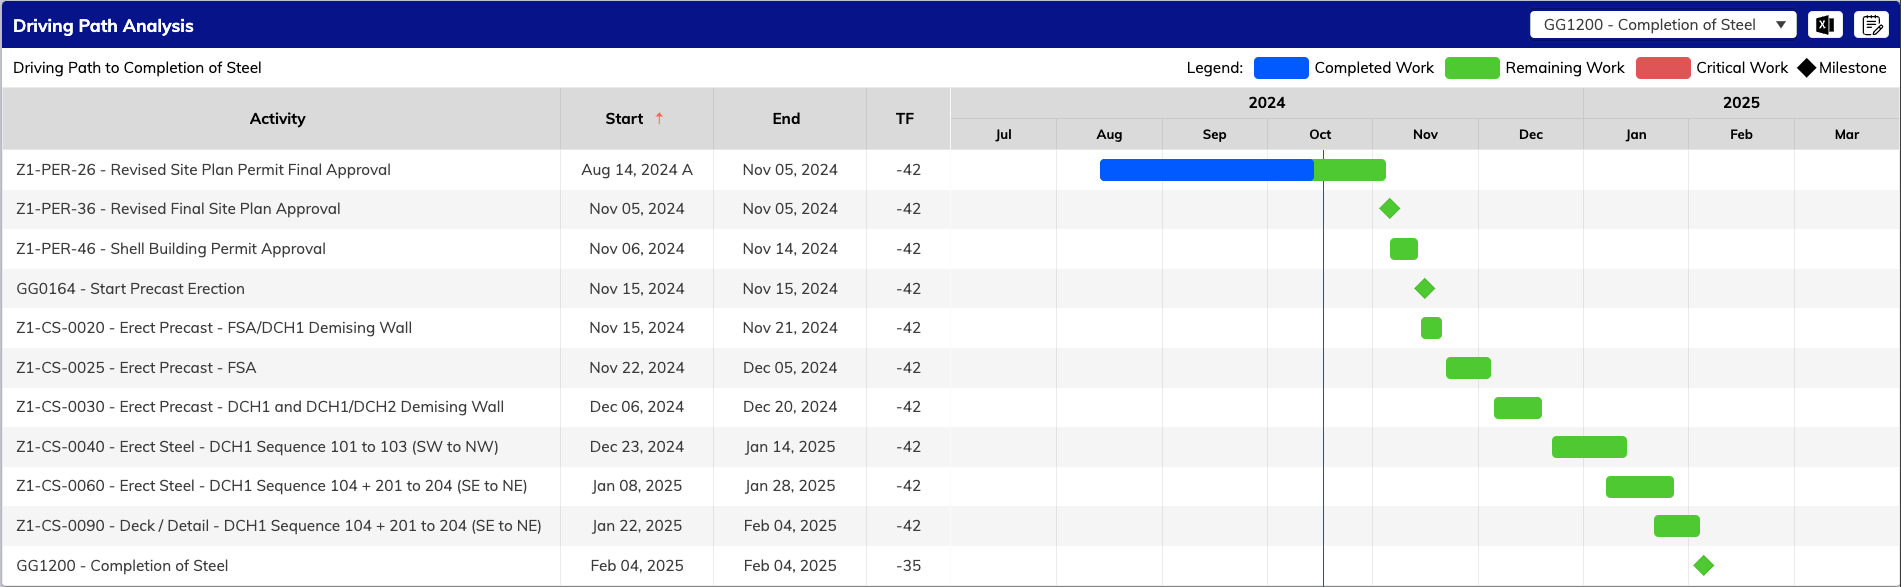
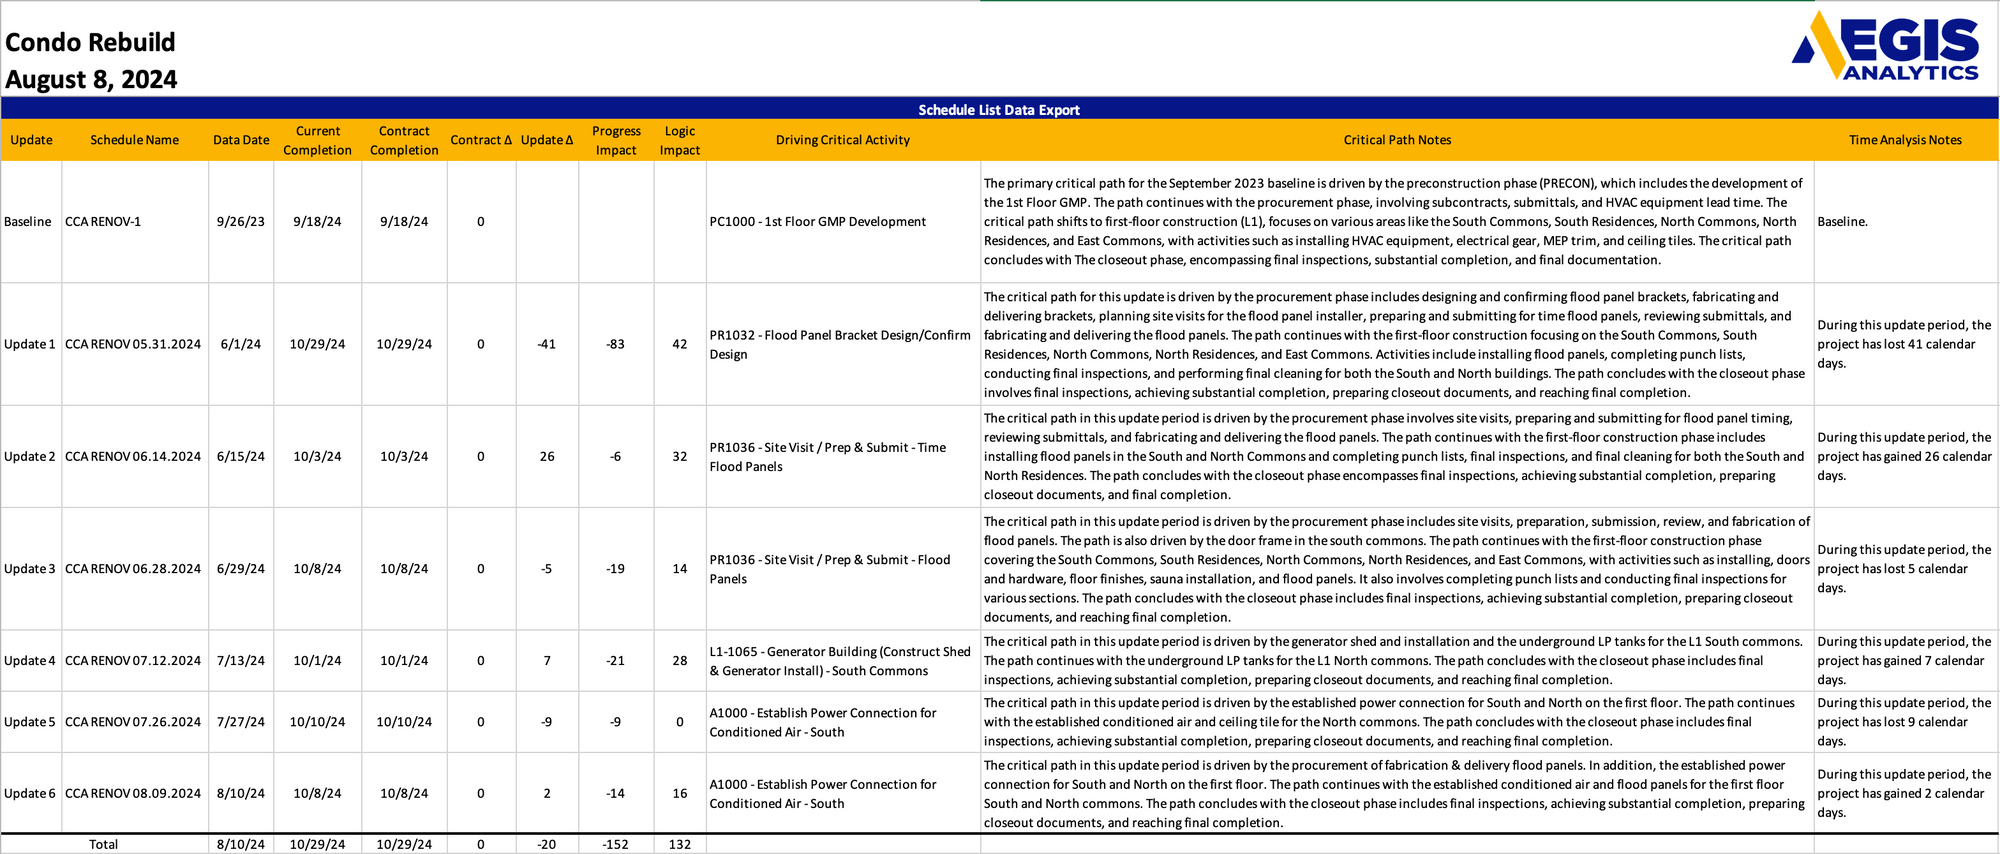
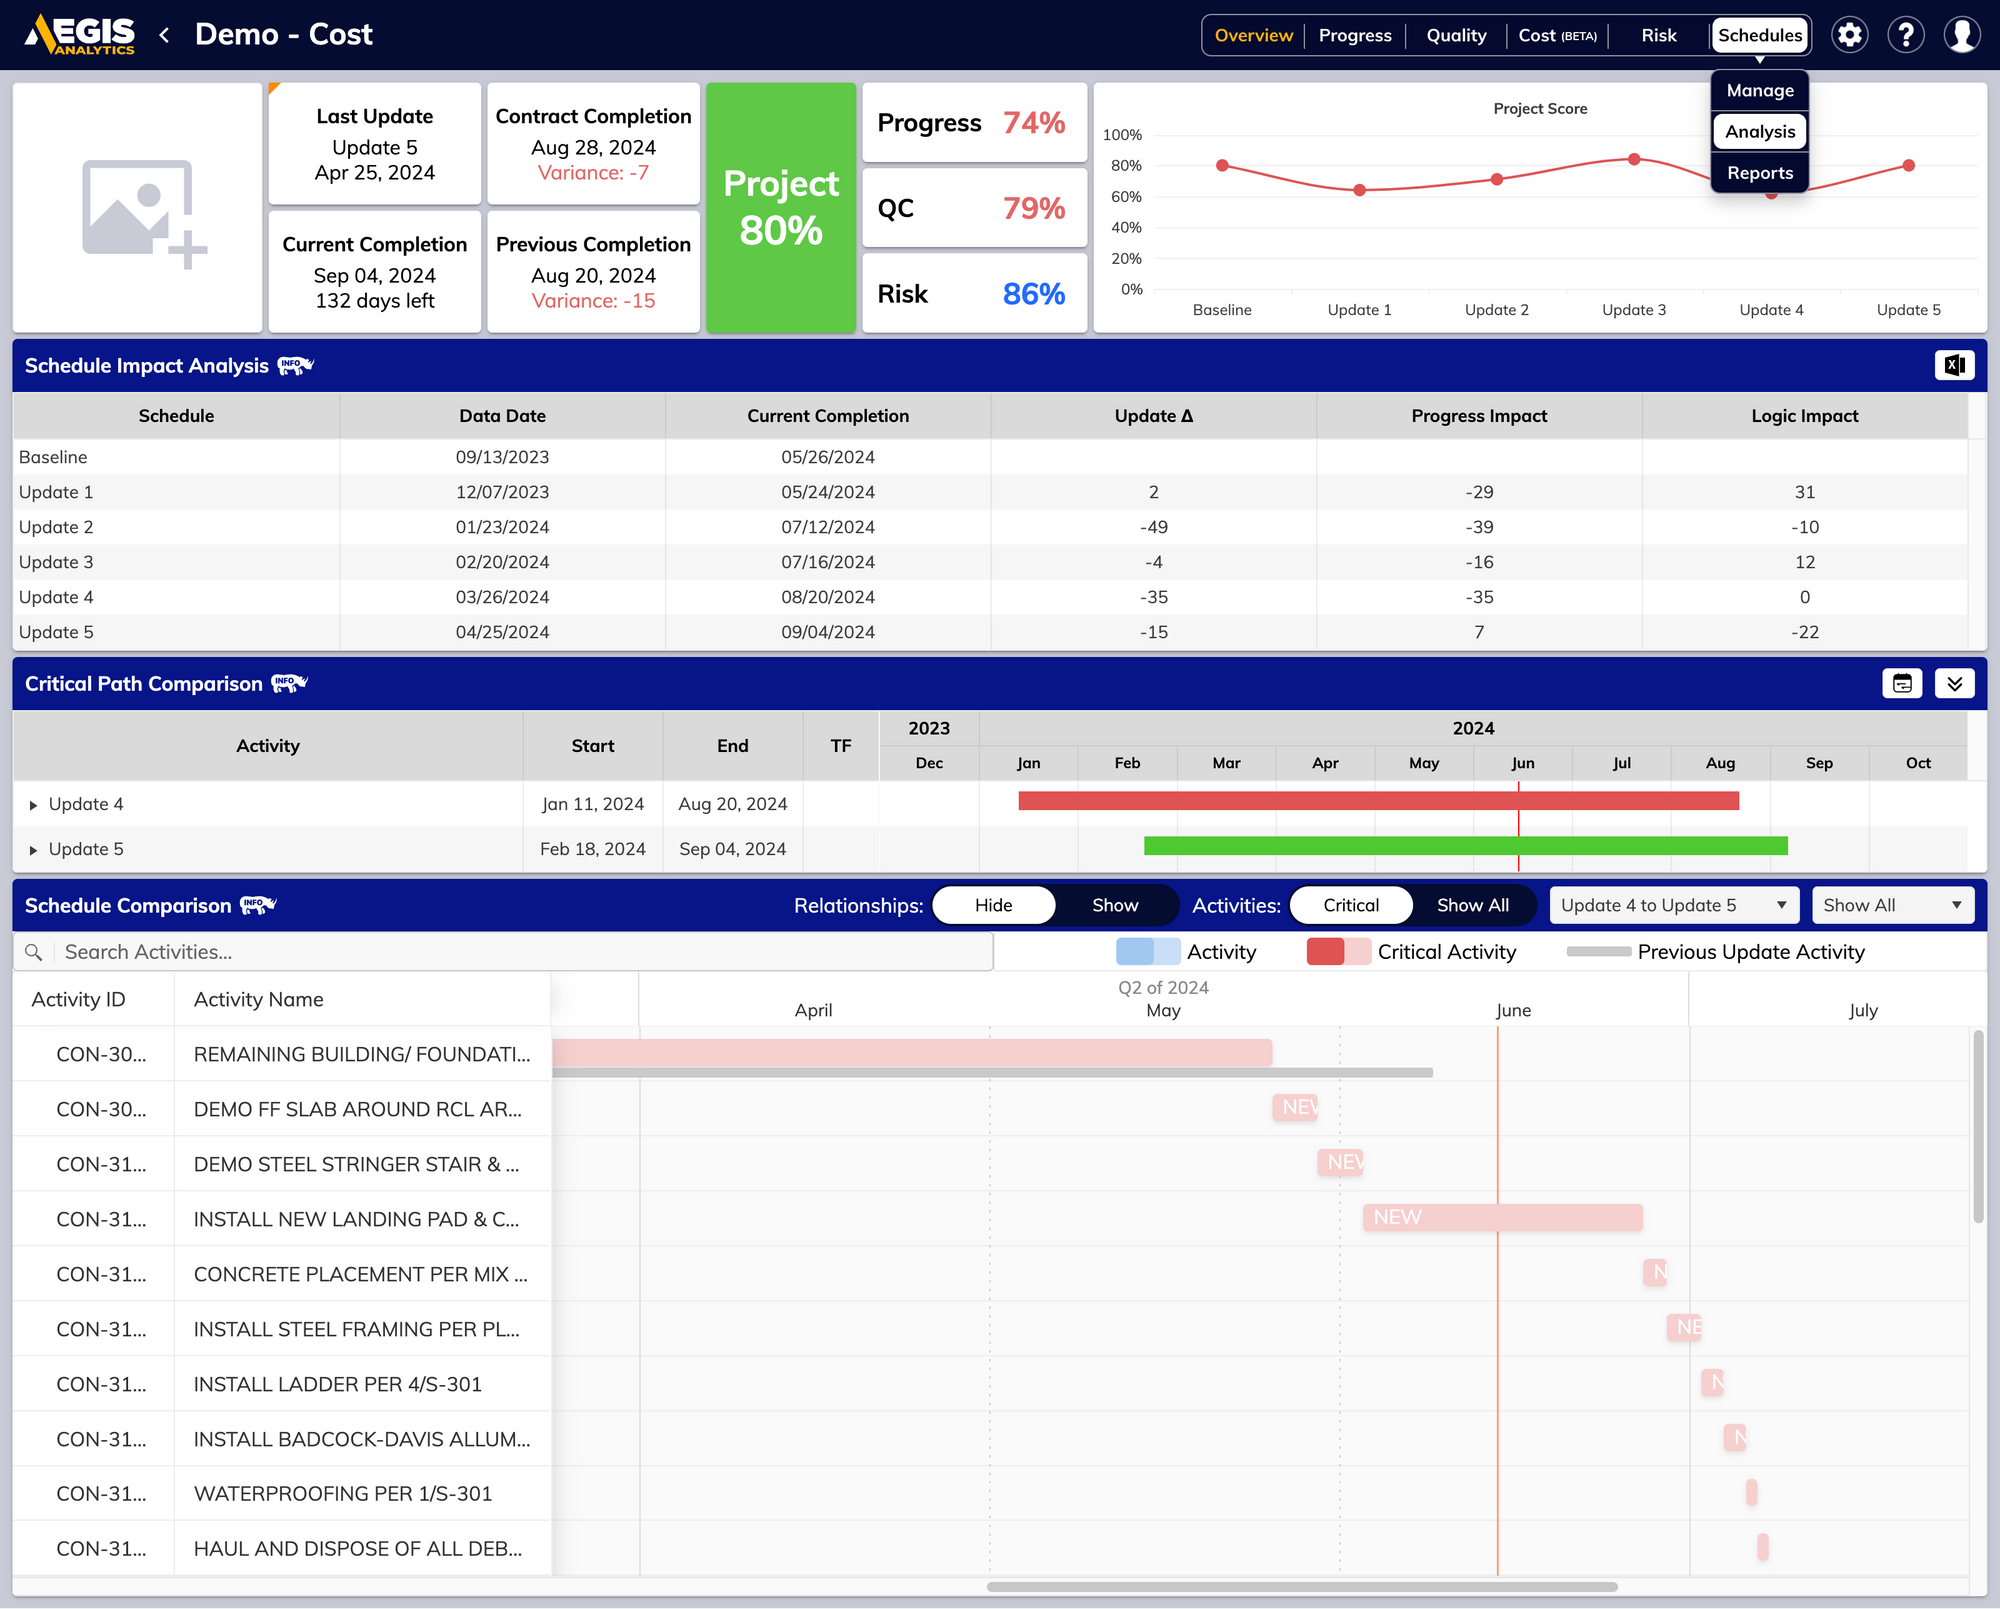
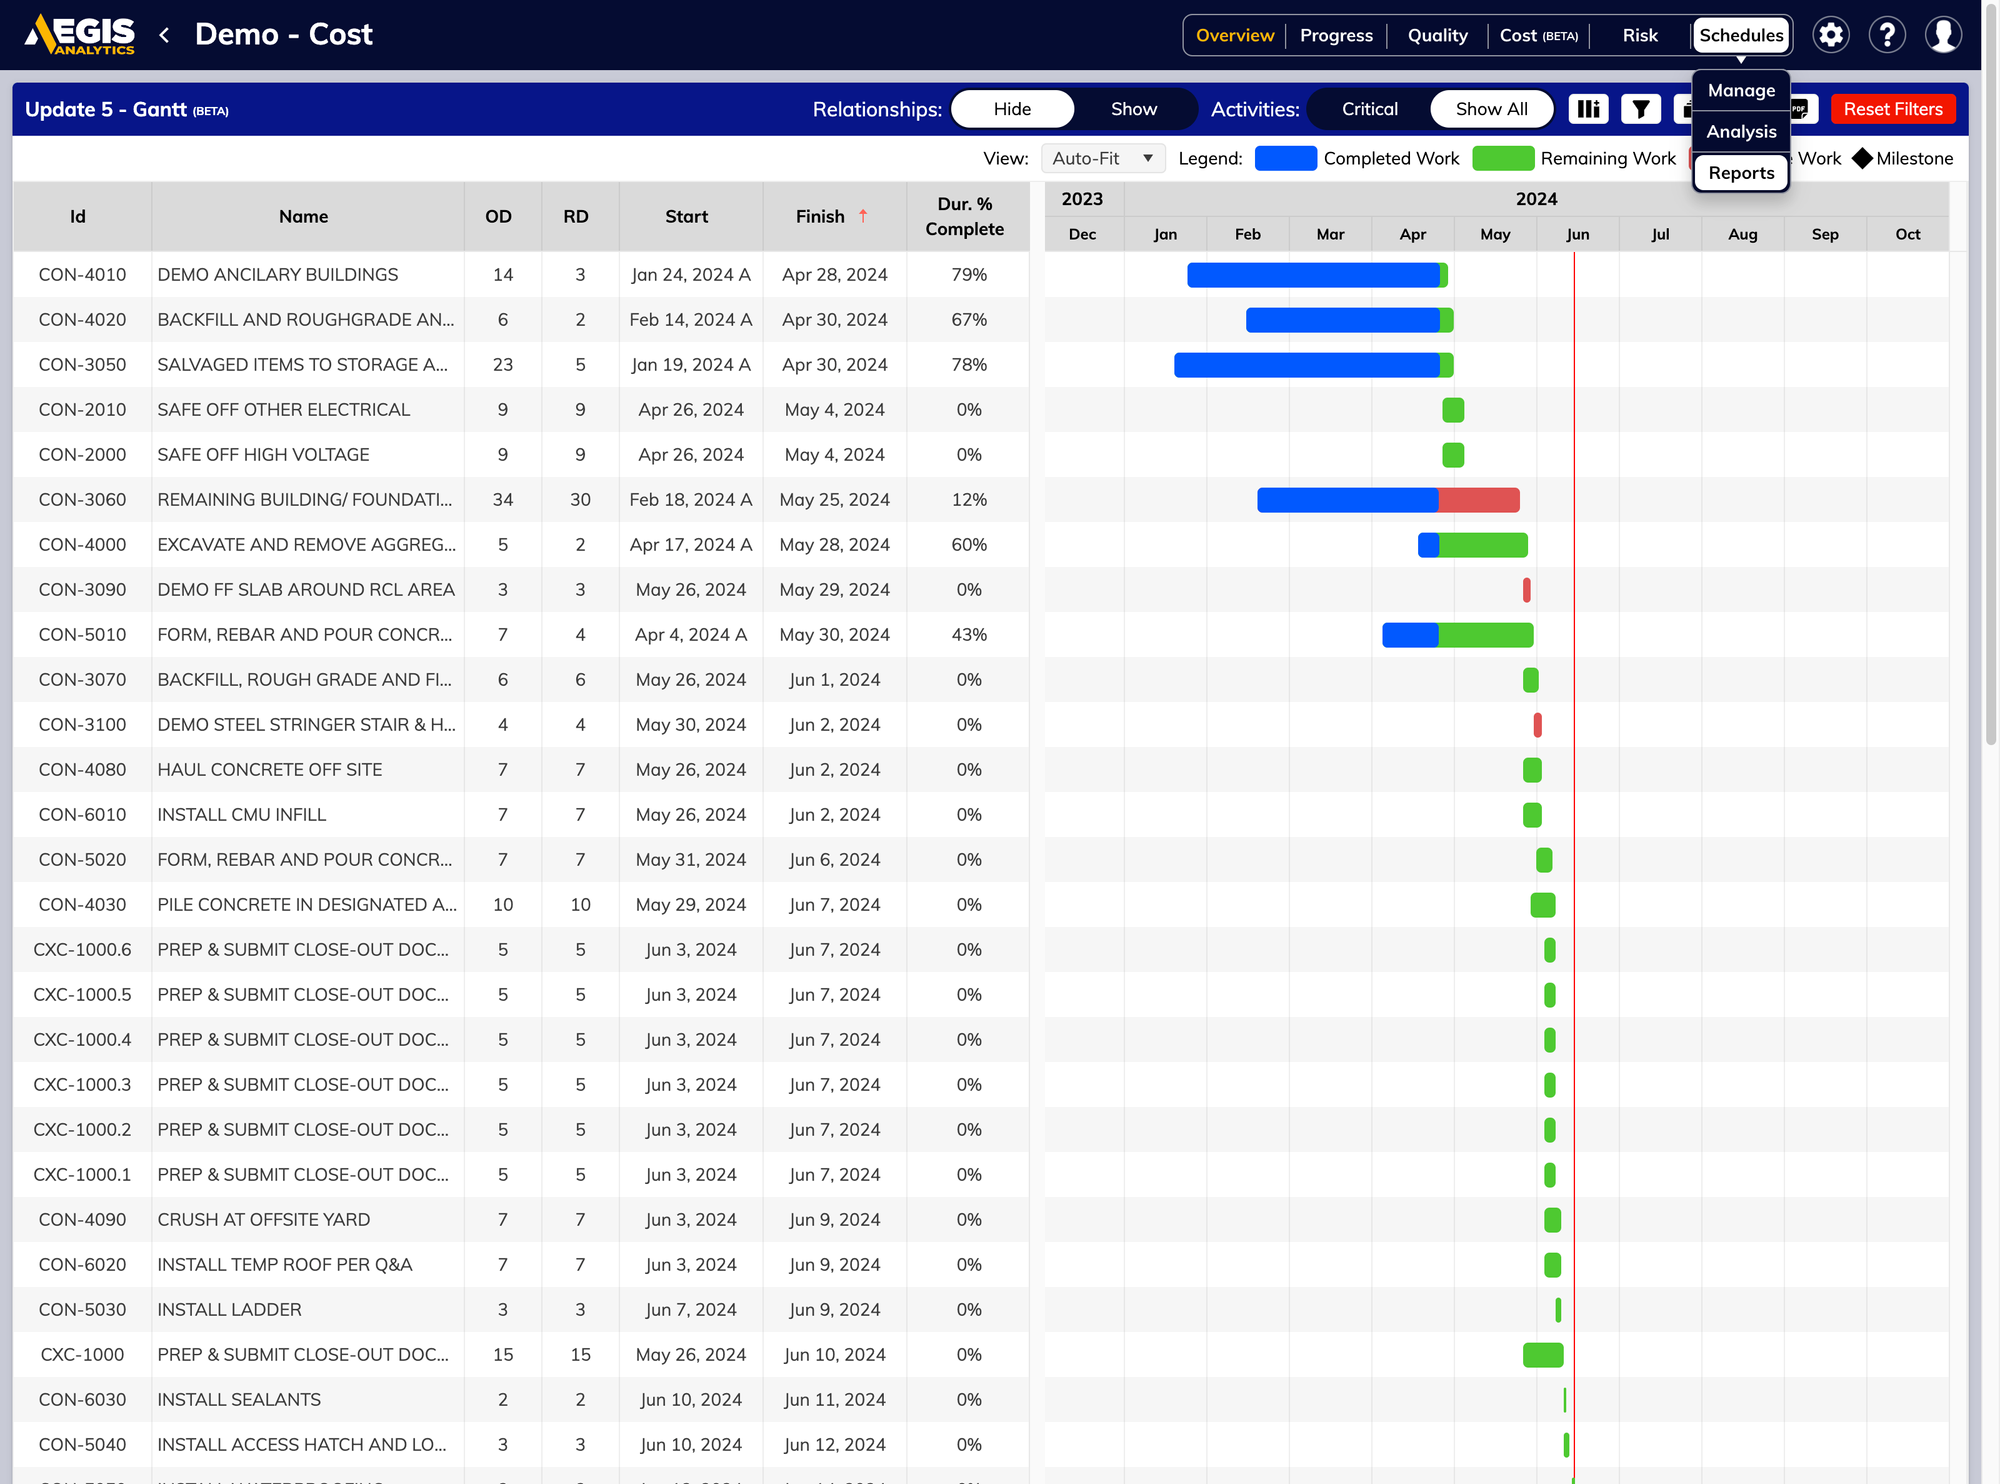
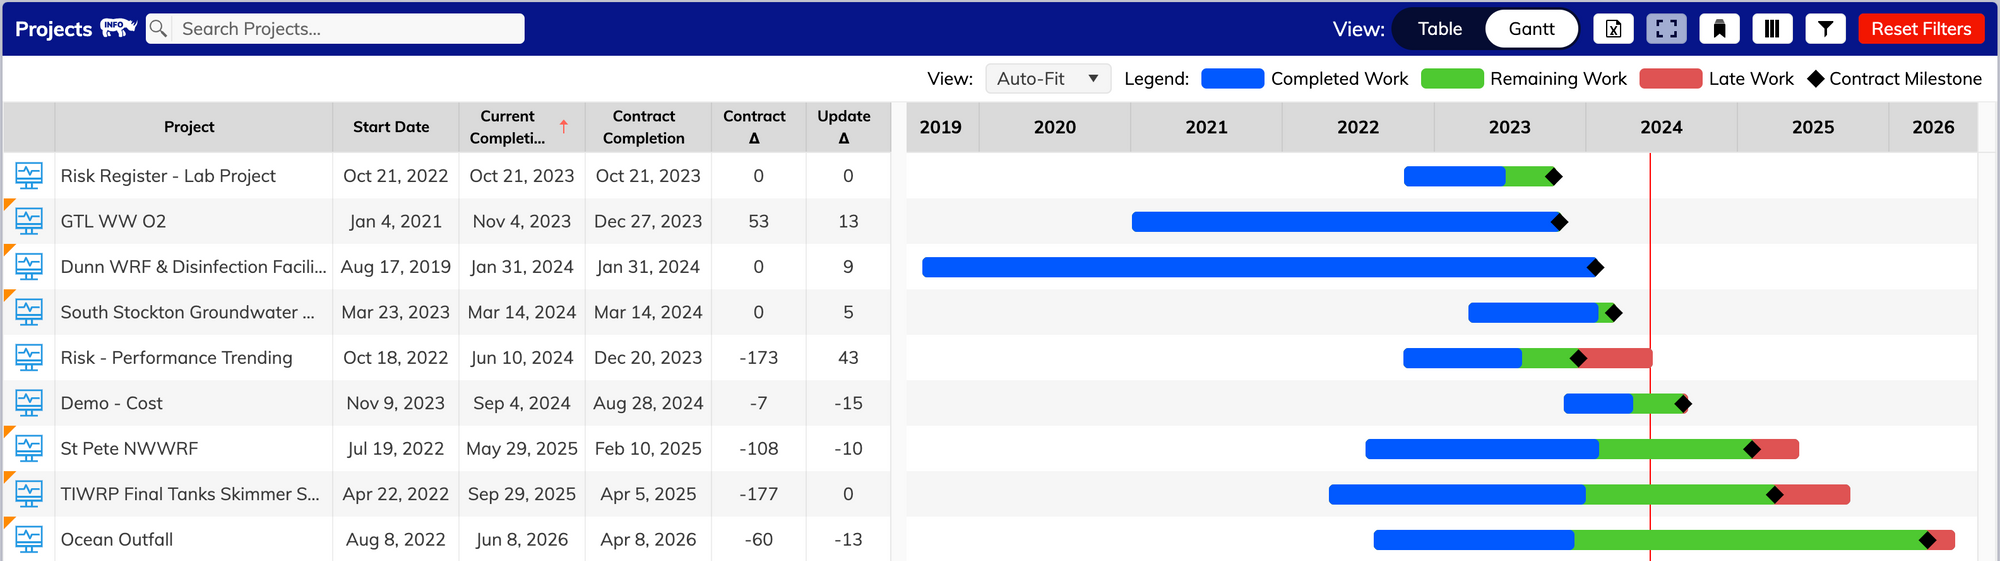
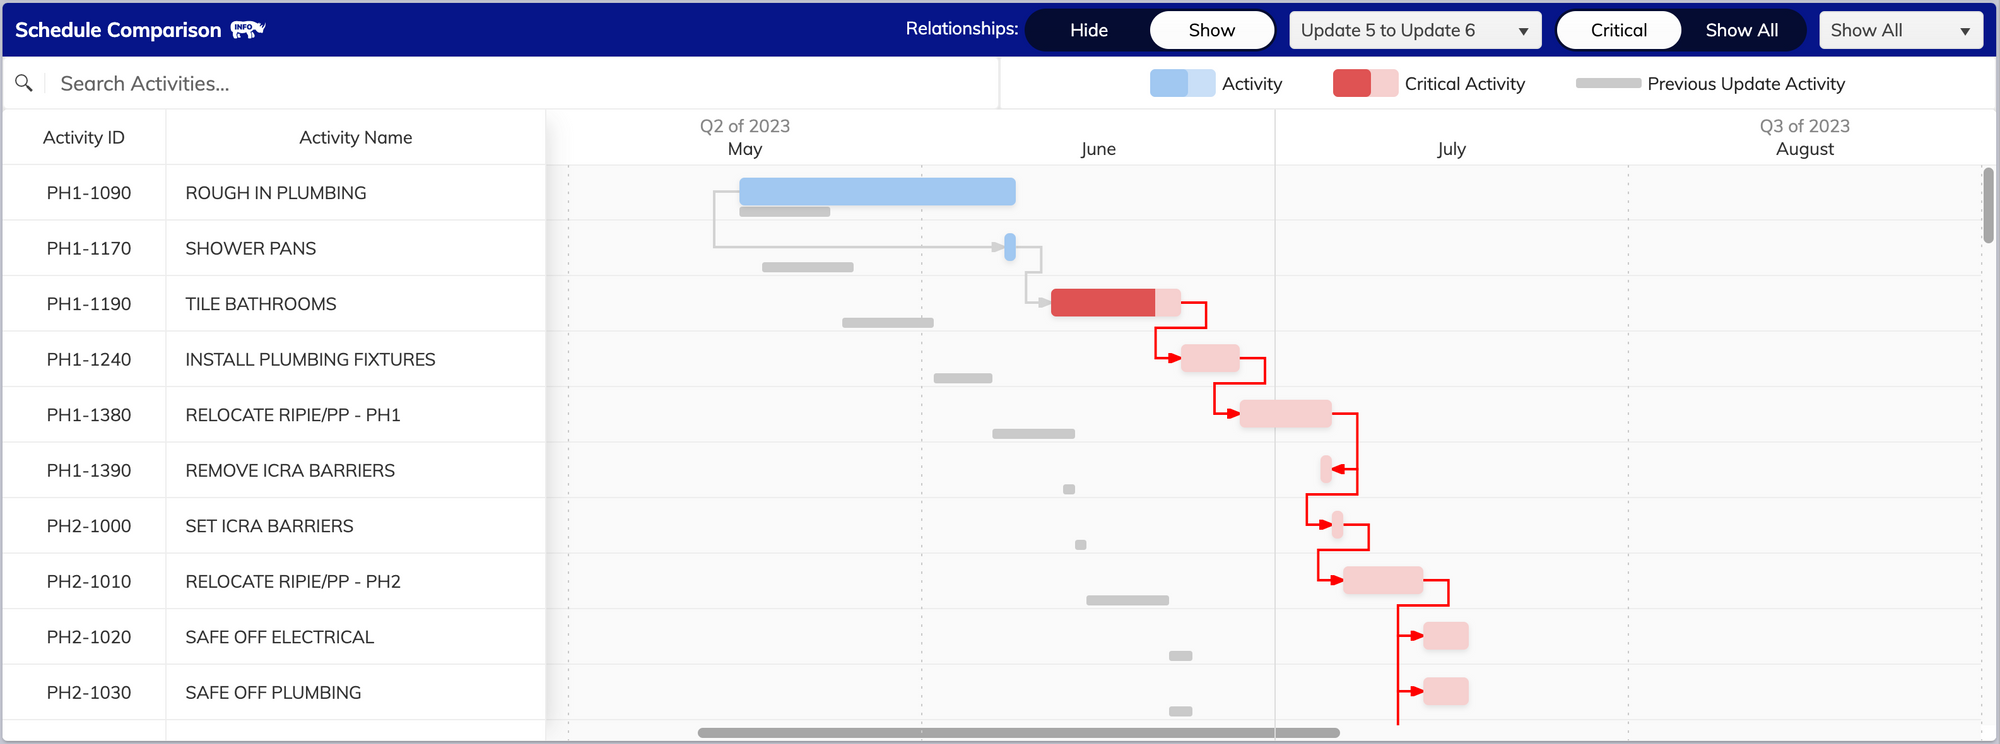
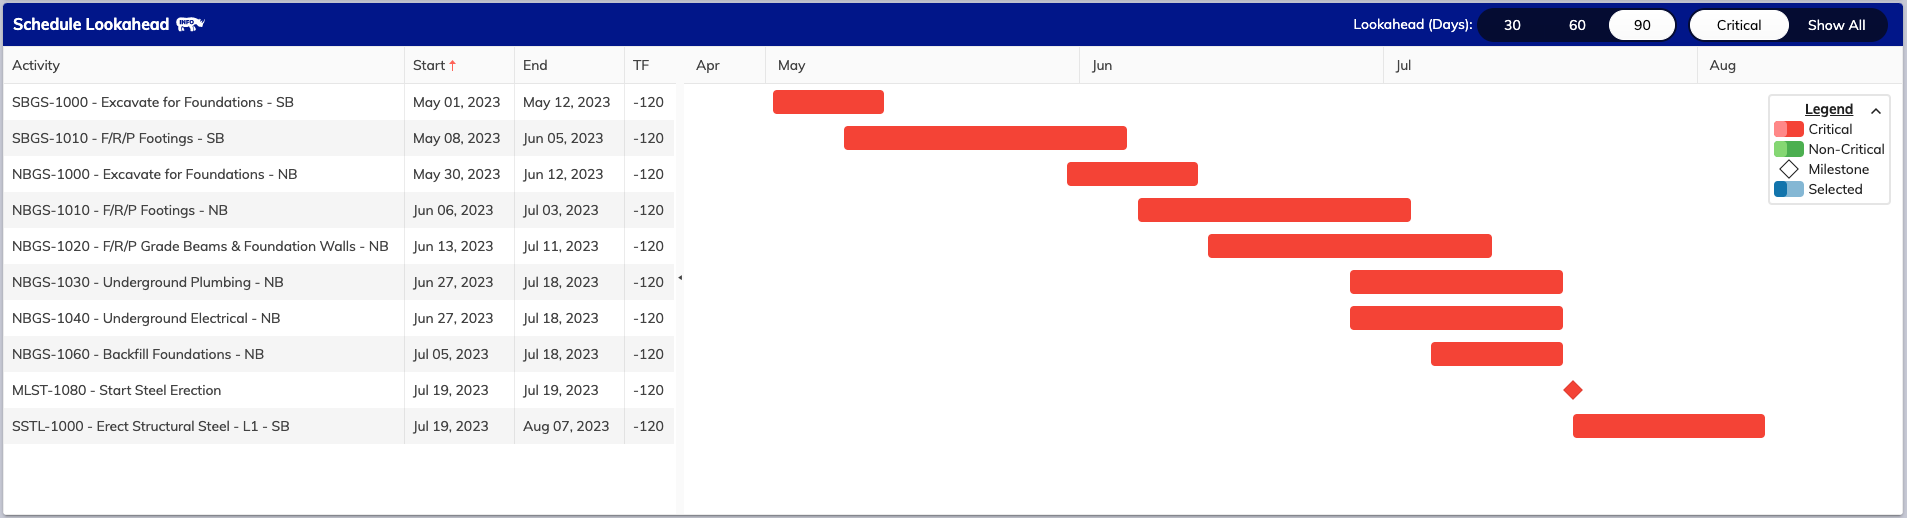
- Driving Path now shows the top three paths, expanding from previously showing only the first driving path.
Let’s prepare by showing off some of the highlights. Or you can grab your board, hit the chair lift and get started today by visiting https://dashboards.consultaegis.com/
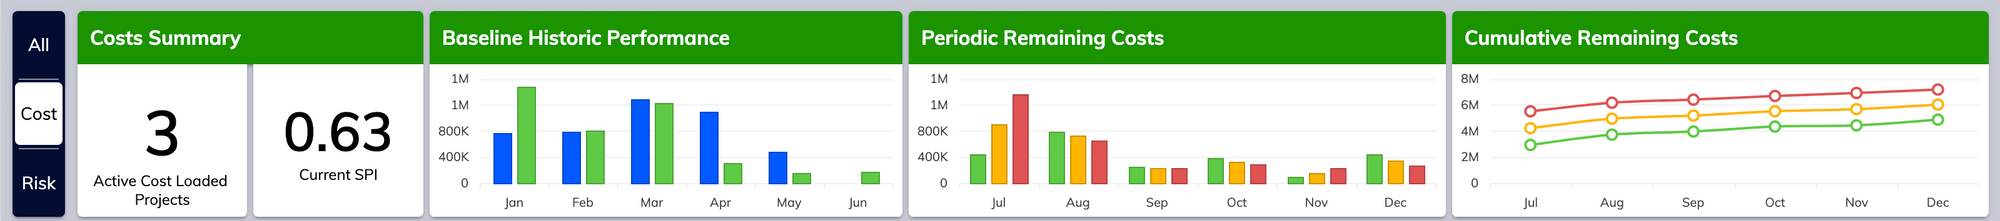
Focus on unique parts of your schedule so you can hit the perfect run. Every time.
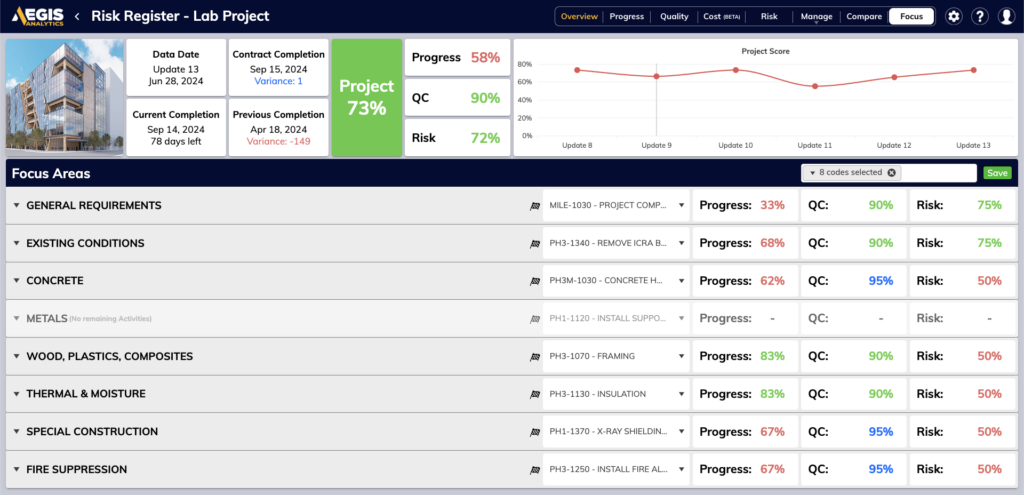
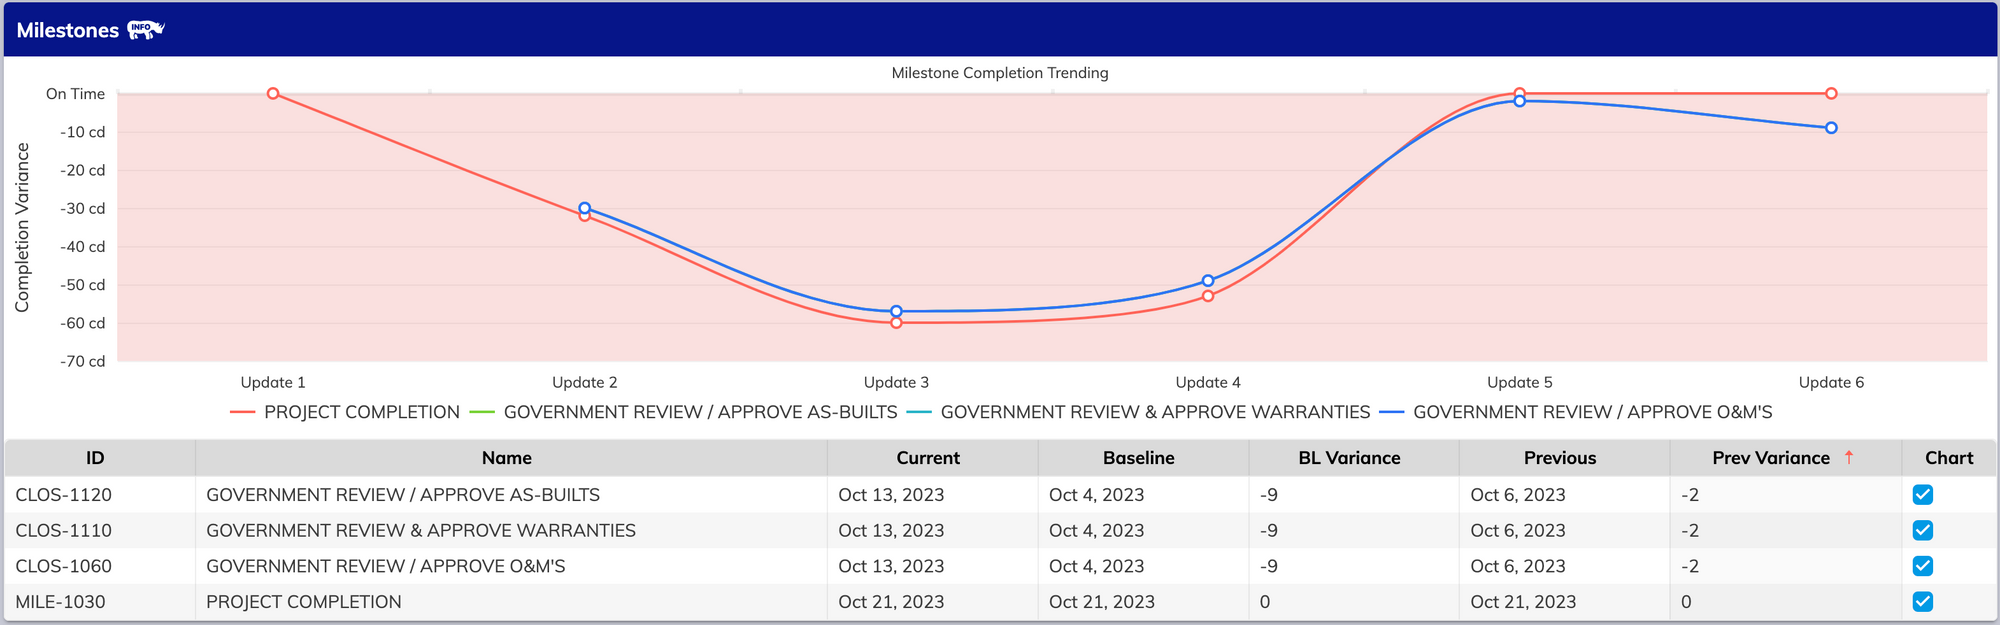
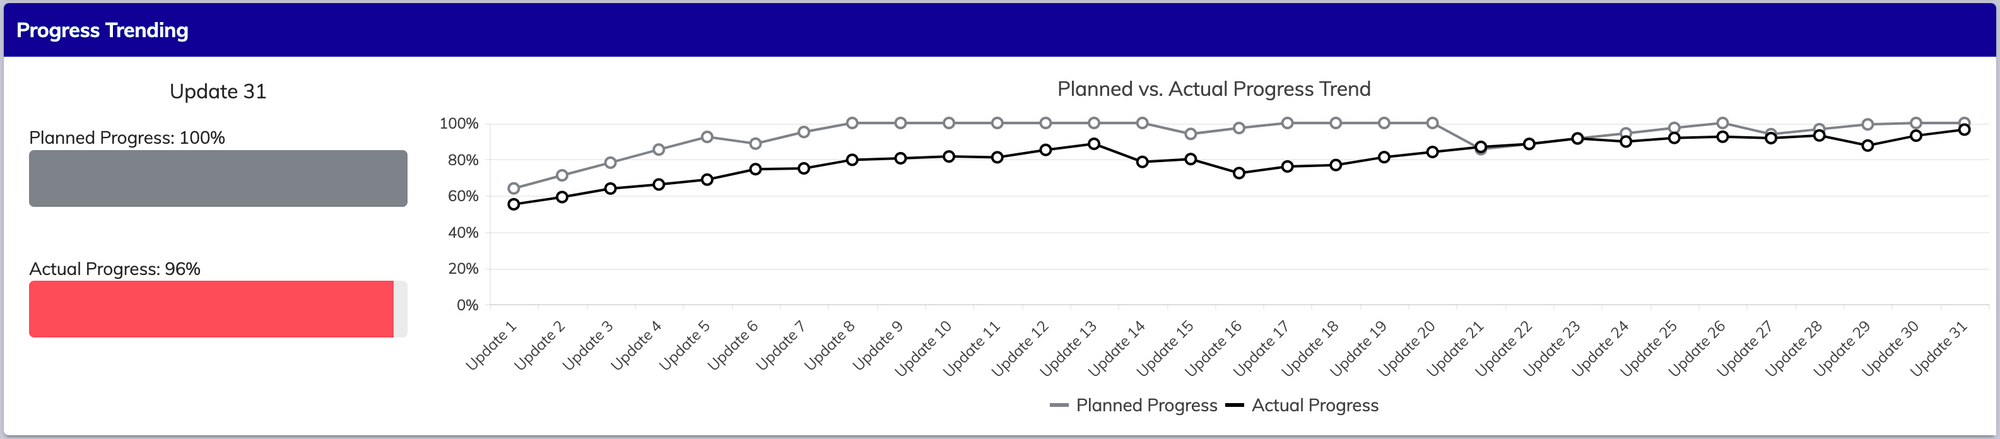
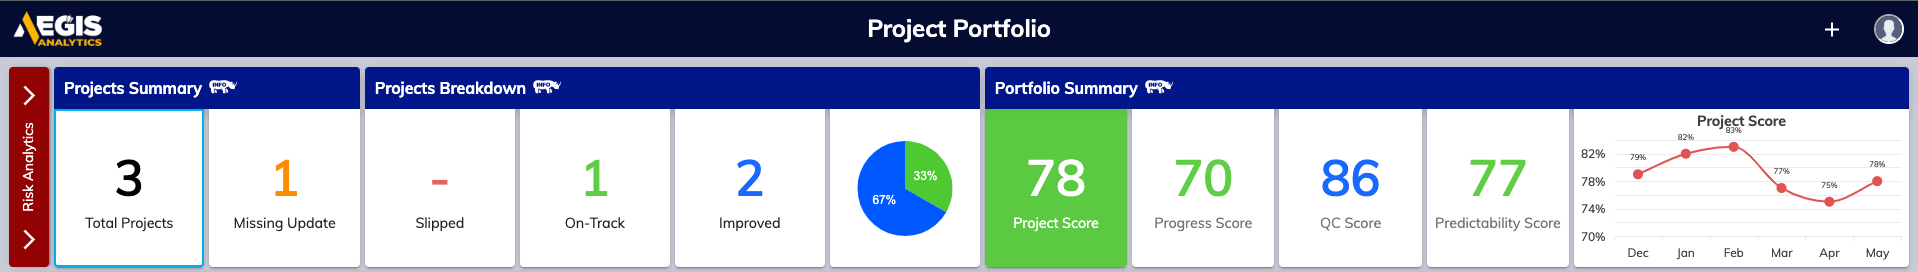
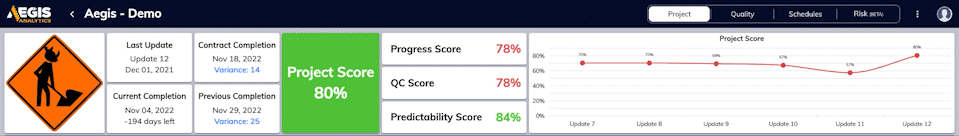
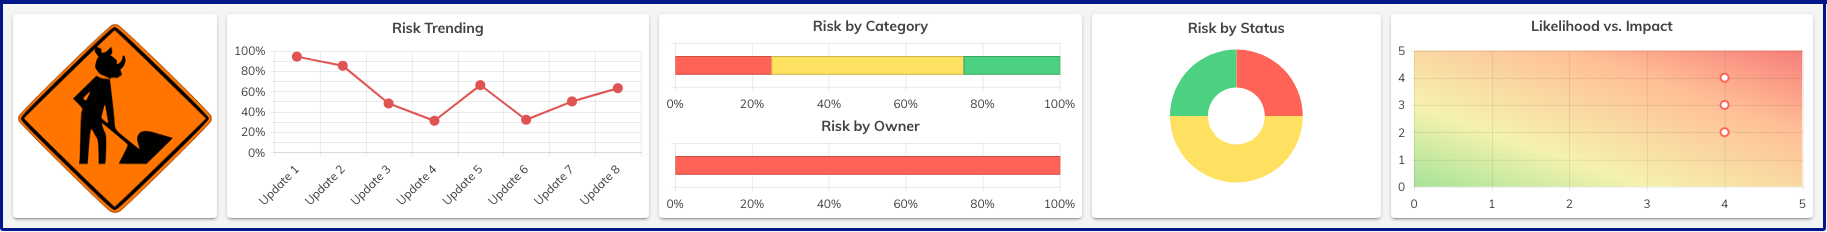
At Aegis, we’re about the details. With the Focus Tab, you can now drill down and generate reports containing Activity Completion (Critical activities are categorized as those on the first driving path), Float Consumption, Driving Path Analysis, QC Review or DCMA (based on quality settings), Index Trending (CPLI/BEI), Critical Path Risk (uses first driving path), and Critical Path Reliability (uses first driving path).
These focus areas can be modified at any time, allowing you to focus on how each part of your project is going to tackle those often-overlooked areas for improvement, and highlight overachieving areas. Easy to understand at a glance, yet comprehensive enough for analysis and optimization.
Determine the quality of your schedule on your terms. We’ll adapt to you.
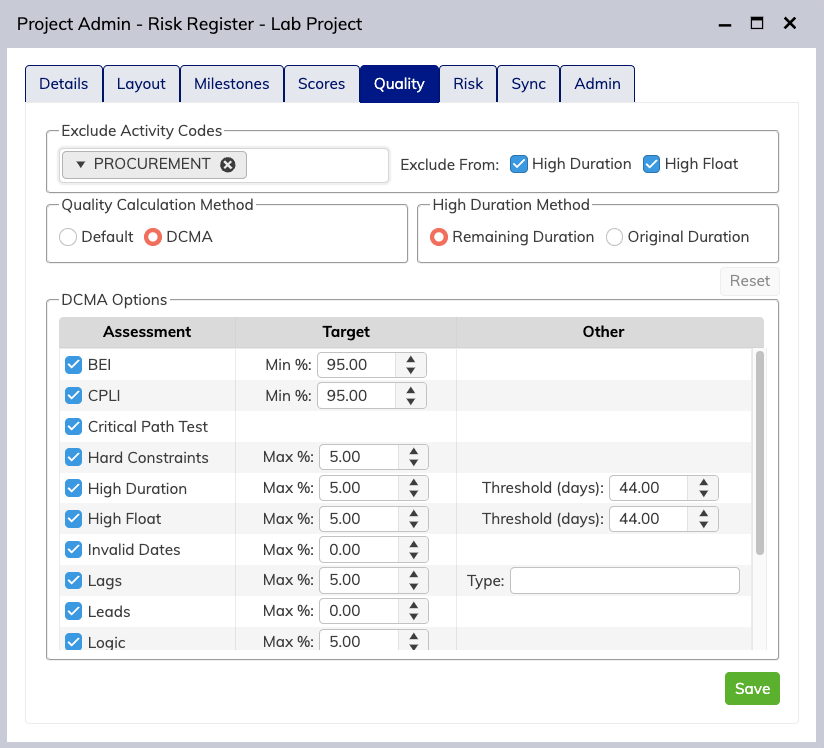
Quality Settings can now be modified to exclude specific activity codes that may not need QC consideration. This puts the power back in your hands by allowing you to use custom codes for areas like Procurement without worrying how they will impact your overall score.

In addition, you can now issue custom DCMA-based tests with adjustable thresholds to meet individual targets that may have different calculations for Quality than the industry standards or our Aegis-standard tolerances.
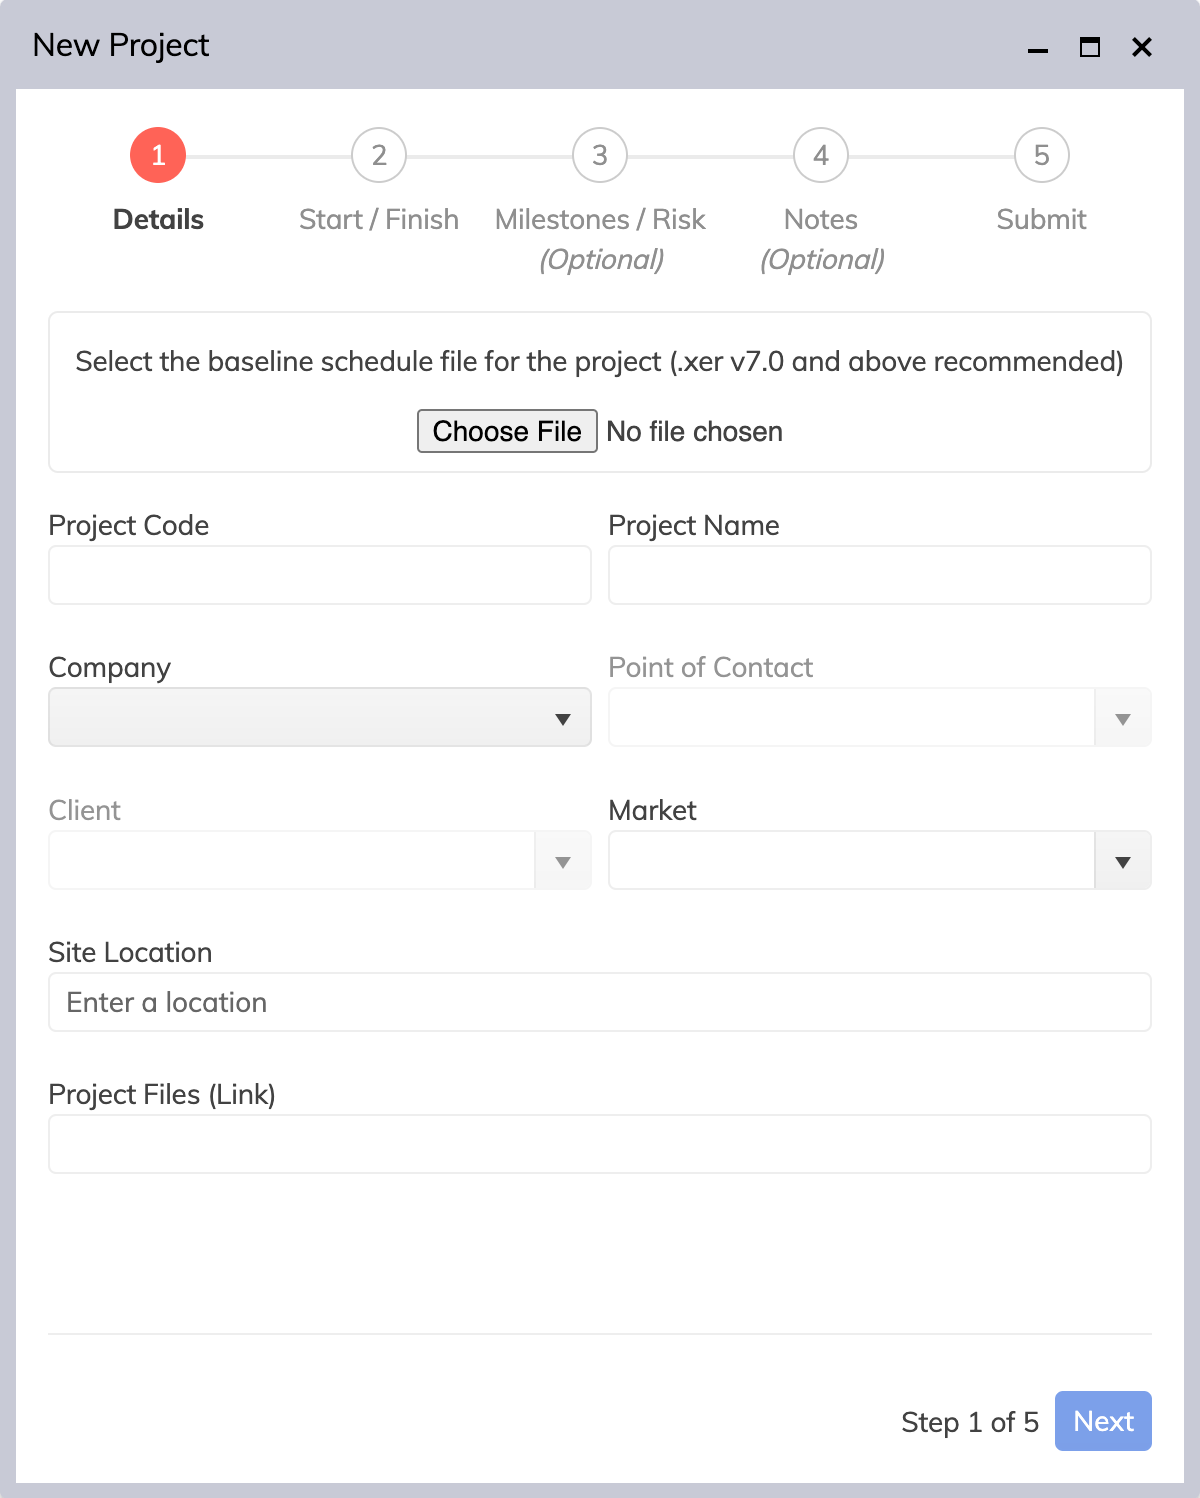
Layout control – so simple you’ll think it’s the bunny slope.
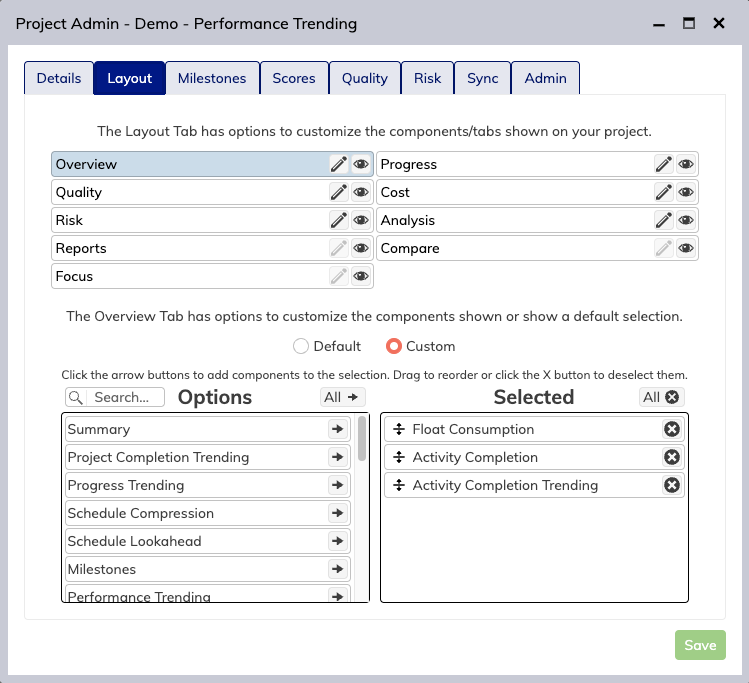
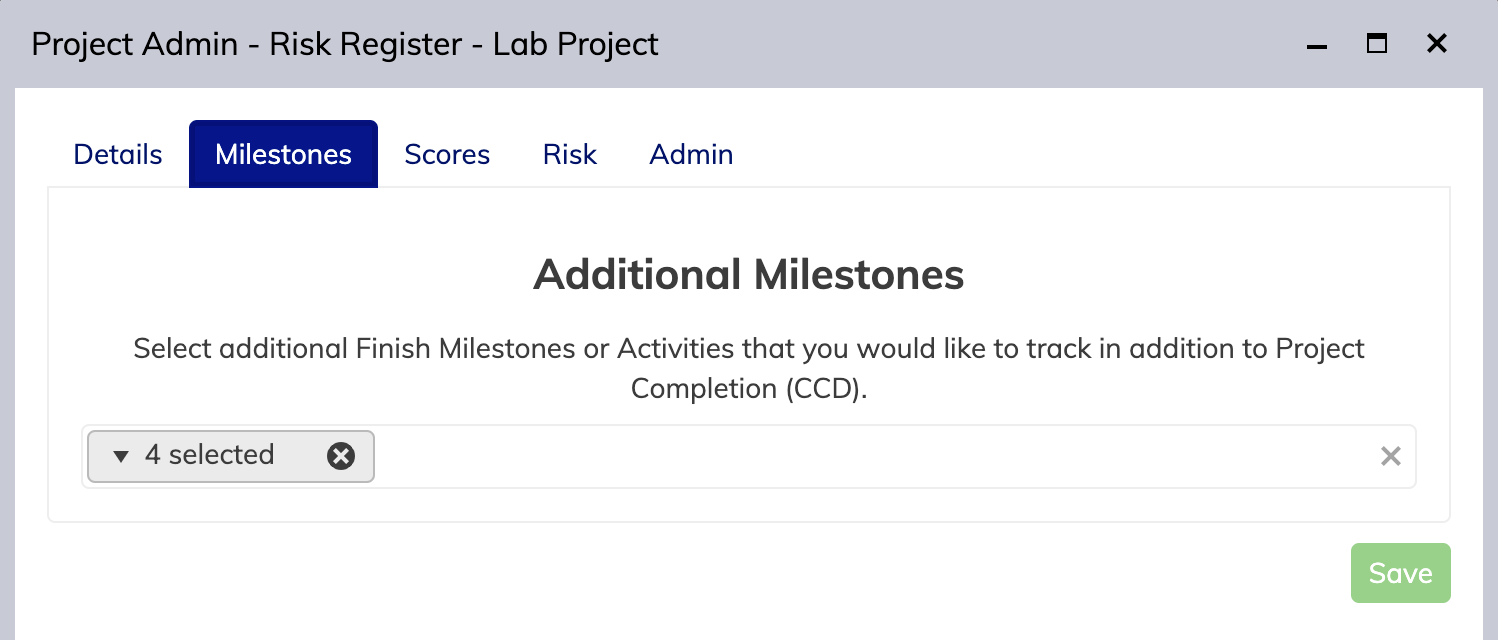
Component and Tab visibility can now be managed in each project with the new “Layout” section of the Project Page. From this section, you can change layouts, manage tab visibility, and set up your project the way you want it to look and feel for the perfect presentation.
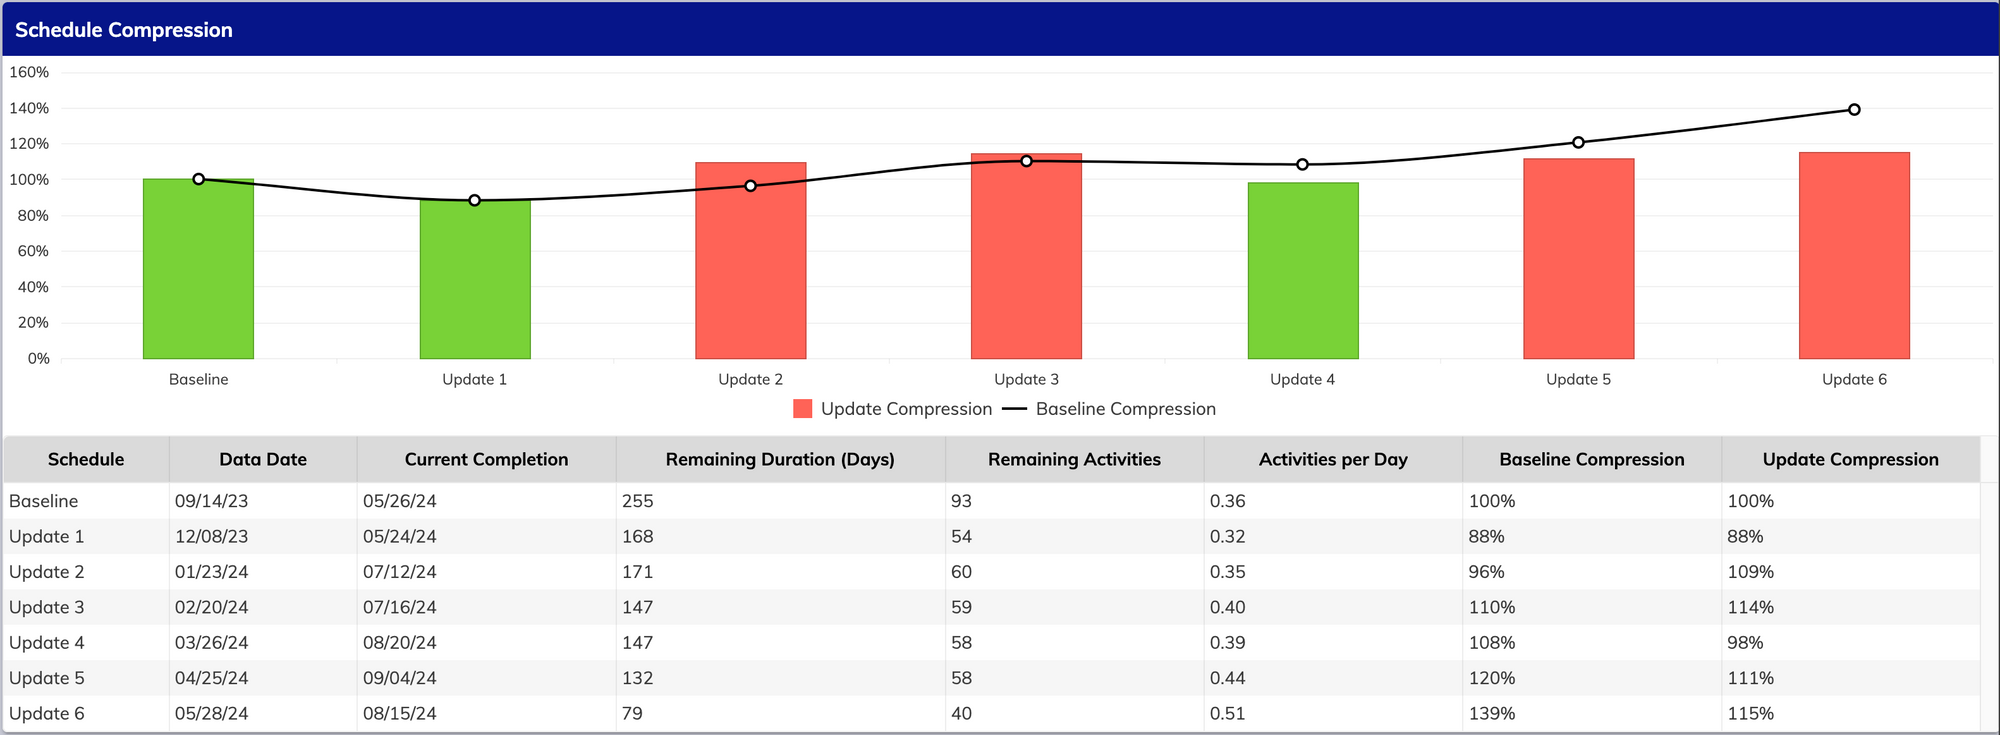
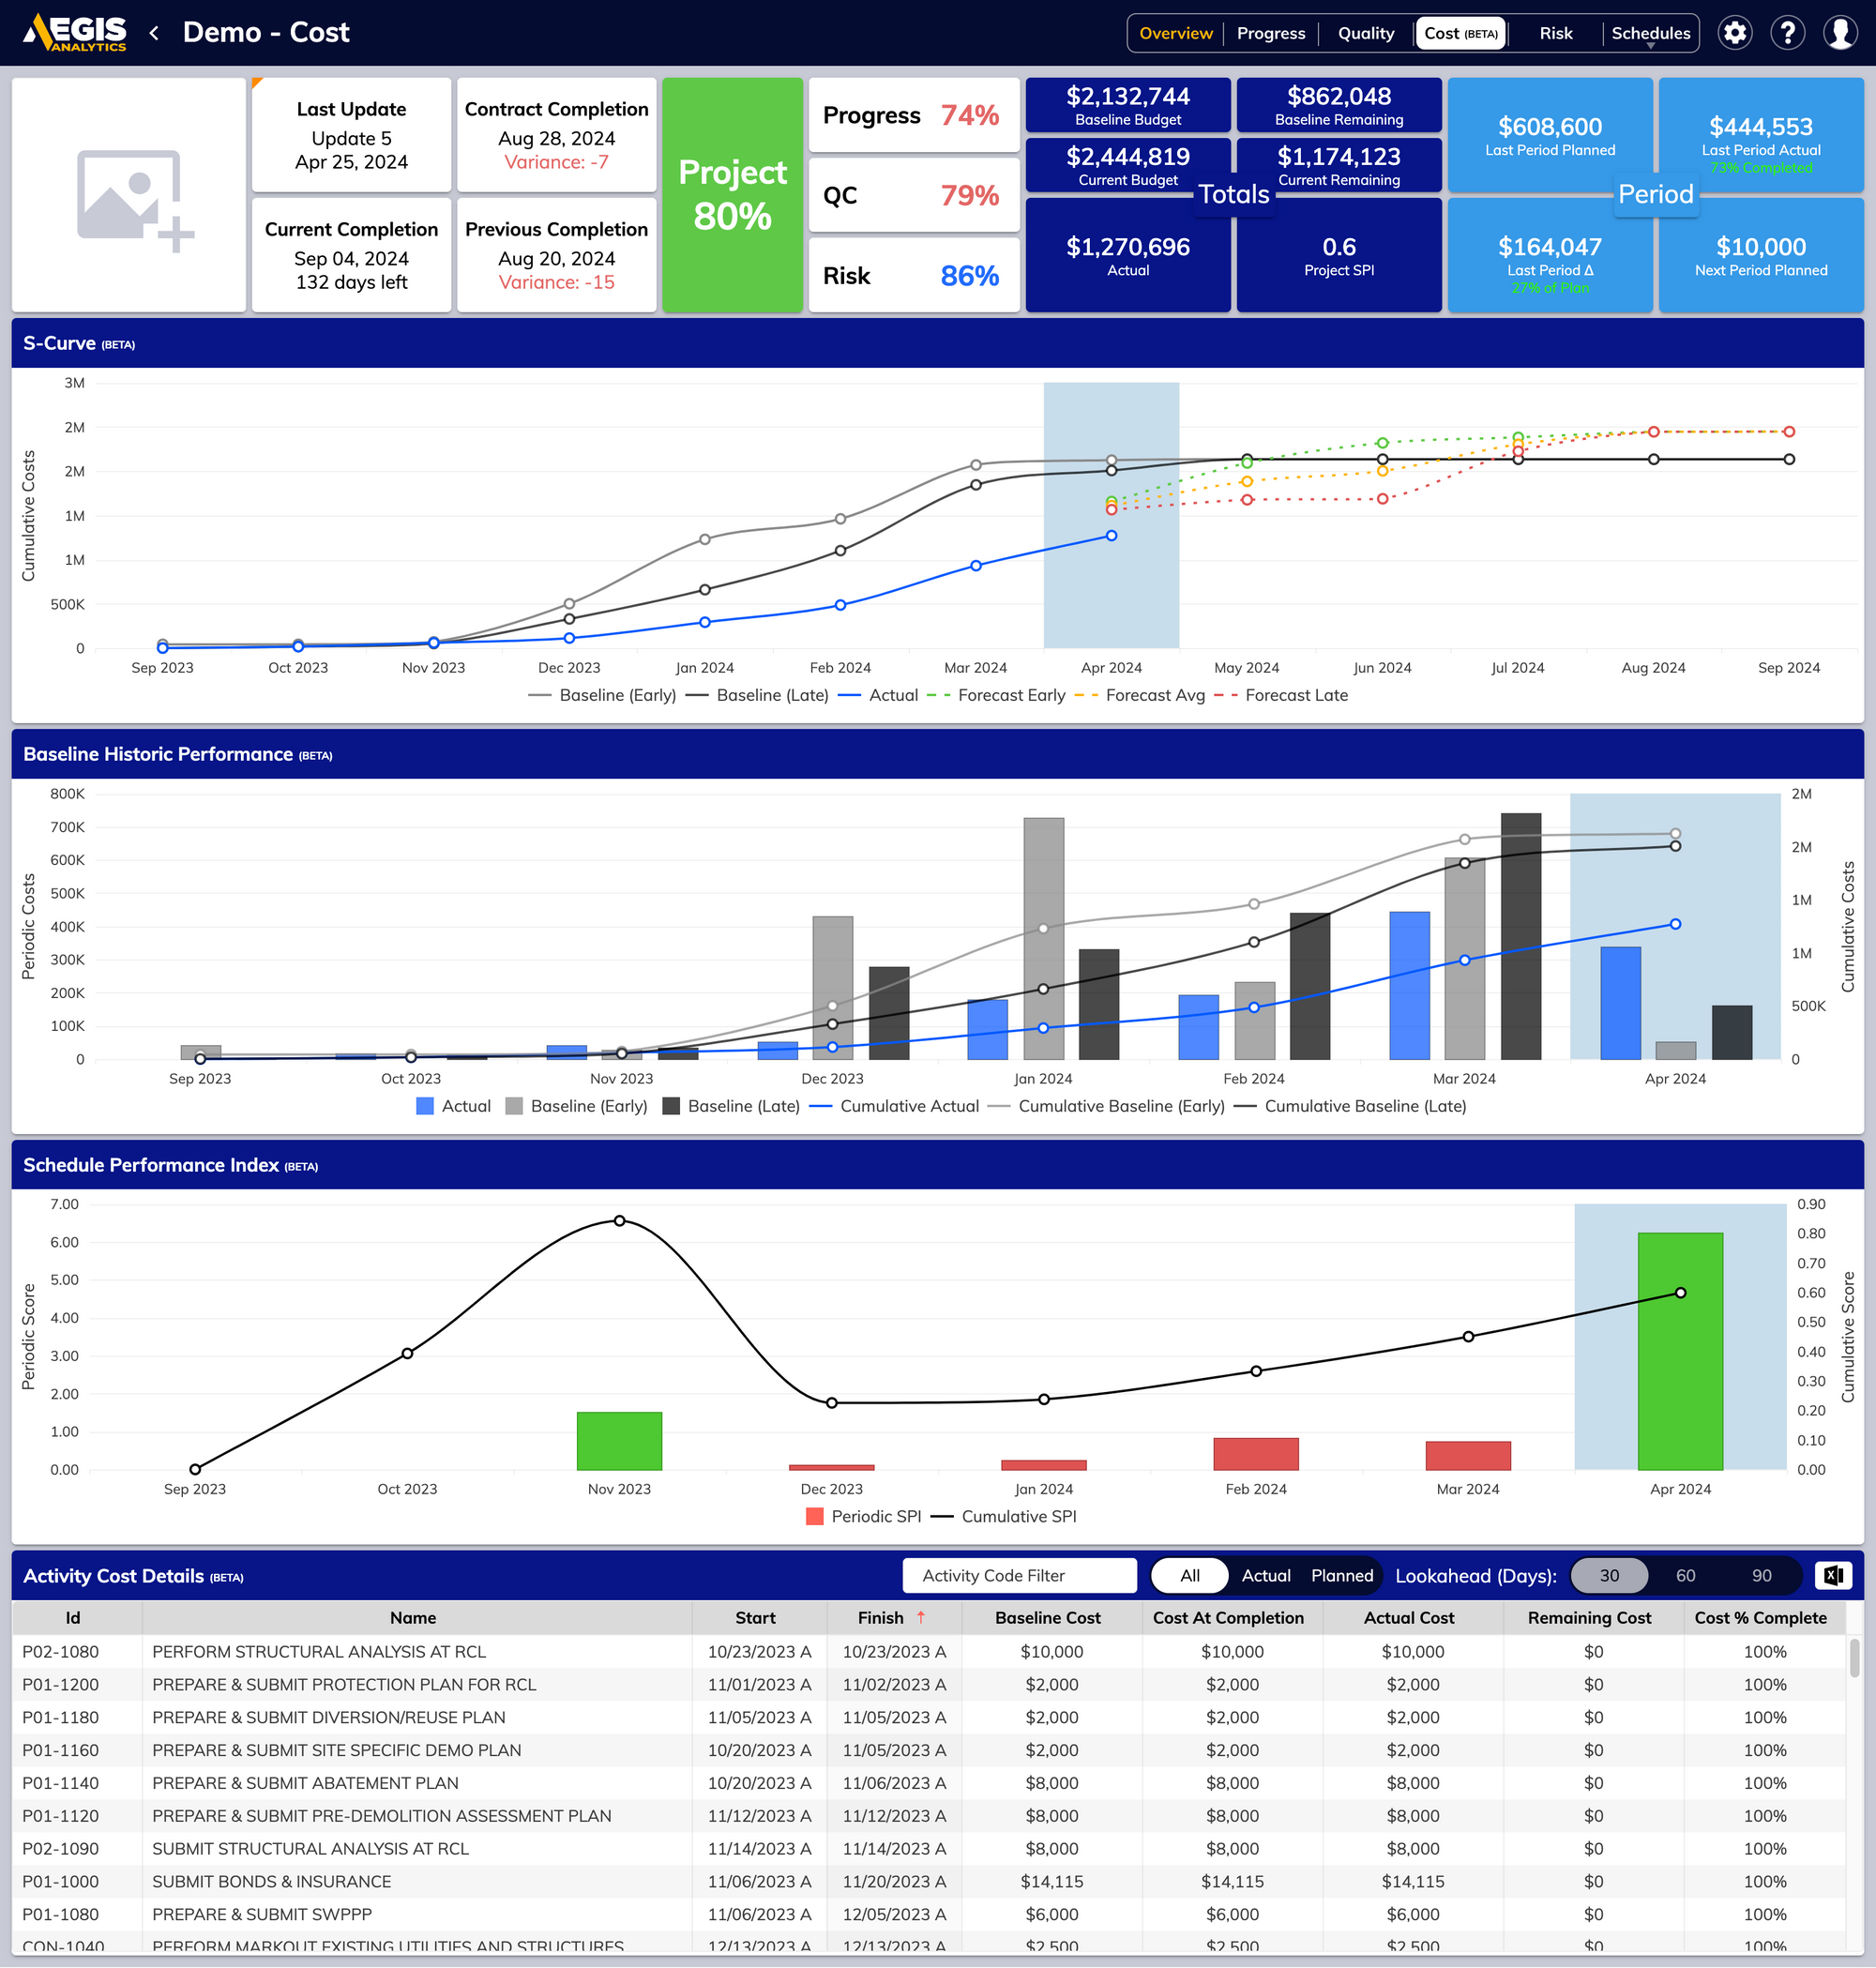
See everything from the top of the mountain with Activity Completion.
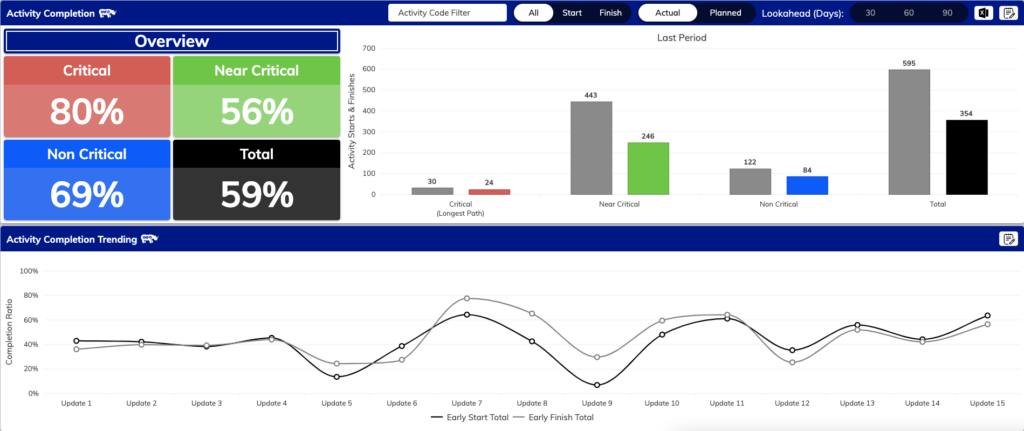
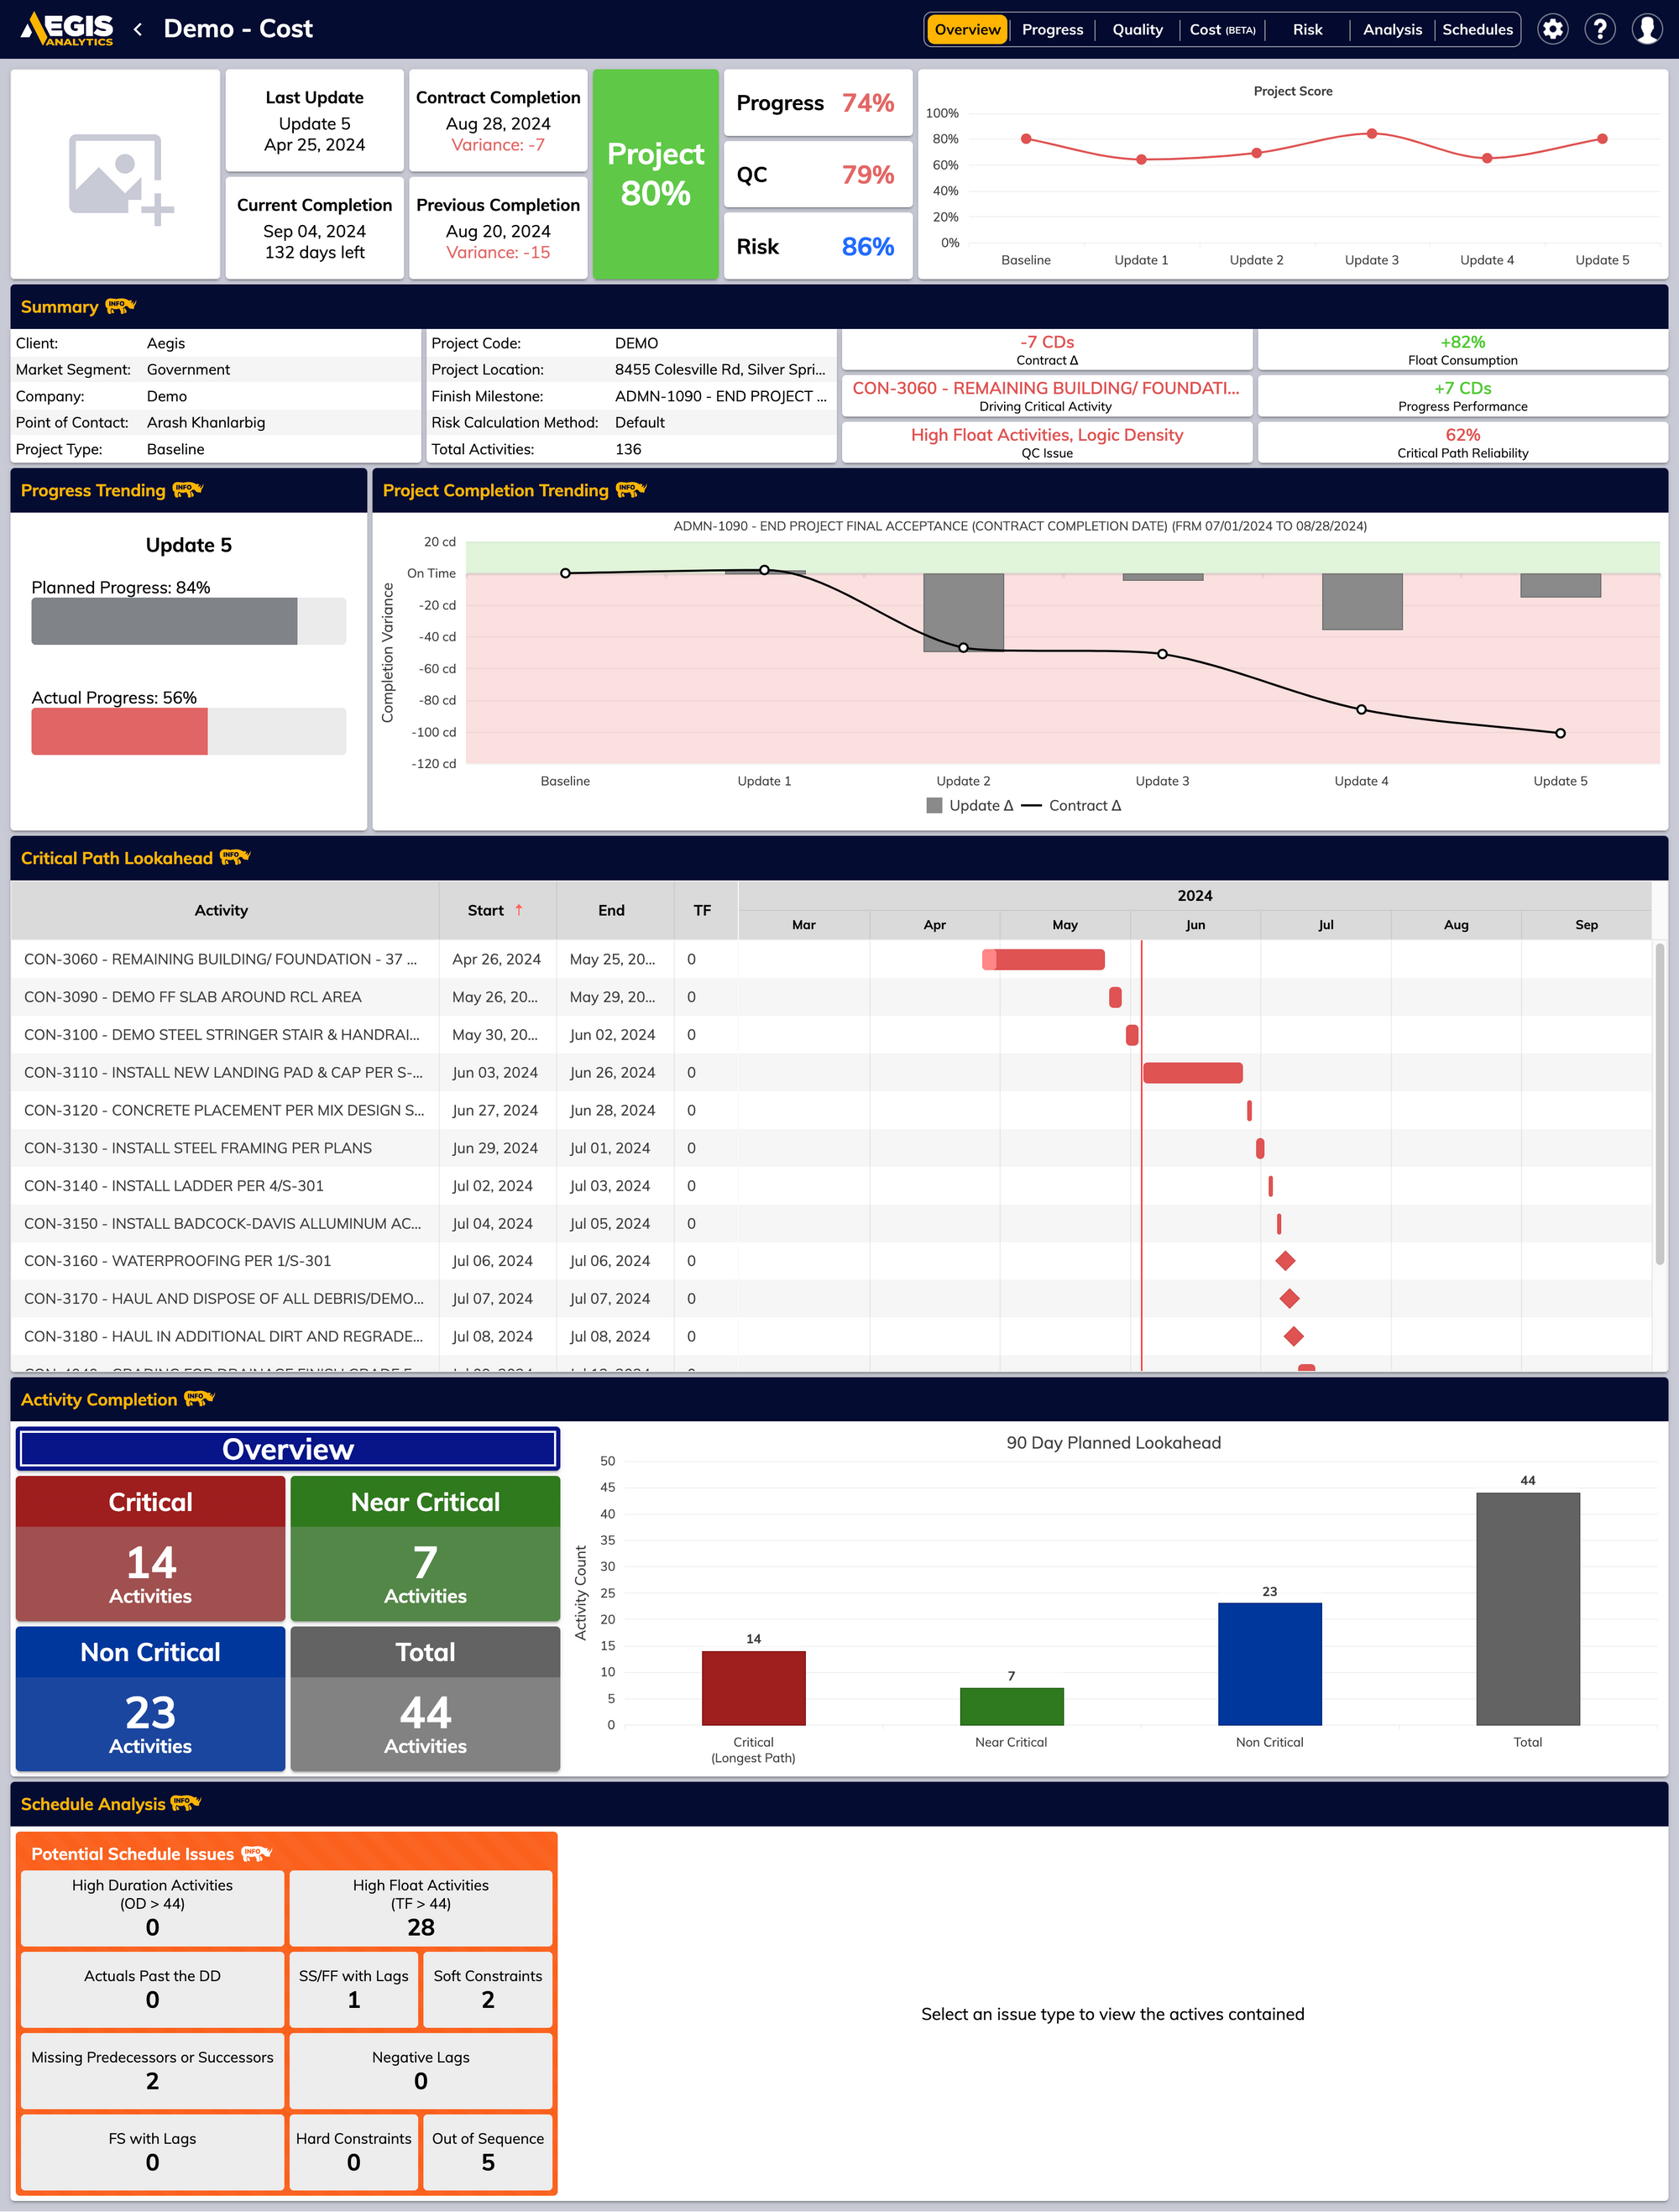
Activity Completion now has a new “All” view in addition to the Start/Finish views for our Activity Completion component. This allows you to show an aggregate of both the start and finish views for the last period graph, planned task percentages, and their corresponding grids.
In addition, the Activity Completion Trending chart plots the total lines from each of the start and finish views so you can see everything that lies ahead of you before plunging down the slope.
So much more to come.
Aegis Analytics is built by professionals that are deeply committed to the small details. We want our platform to be the multi-tool the industry needs, and with these new additions we think it will not only improve your output, but also help you dig deep into the details to unearth actionable insights.
To get started today, pull up a chair by the fire in the ski lodge, grab your warm drink of choice, and visit https://dashboards.consultaegis.com ⛷️