A minor release with some major upgrades, we’re punching well above our weight with our newest edition of Aegis Analytics.
v5.2 release summary:
- P6 database connection – import and sync schedules
- New risk type – core risk
- Compare tab – schedule comparisons
- New performance trending component
- New driving path analysis component
- Activity start tracking
- Customizable overview tab
- Report center and batch exports
- Component-specific notes
- Data fetch and loading speed improvements
Connect to P6 directly
You can now sync your Analytics projects directly to your P6 database through a one-time import or scheduled sync. XER uploads are no longer required! And that’s not all. We also support connecting to Microsoft SQL Server instances Aegis does not host, so we are officially BYOD! (Bring your own database!)
Note: Connecting to databases not directly accessible to the internet is a feature in active development and will be released in the next update. Oracle SQL Databases will be supported in future updates.
Automate your schedule imports
With the addition of database connections, you may now also automate schedule imports by setting up a sync schedule in project settings. This allows your projects to remain up to date without manual intervention and recent changes to be brought in automatically.
New risk type – Core risk
We’ve simplified our Risk Register to allow you to identify and assign activities to your risks quickly. For projects using Core Risk, adding a new risk is as simple as giving it a name. To analyze your saved risks using the Monte Carlo Simulation component, simply add the activity impact %, and assign the relevant activities to the risk
You can switch from Core Risk to our full-featured Risk Register anytime to expand on the details of your project’s risks.
Spot the difference
In this release, we focused intensely on schedule analysis. To that end, we have created the Comparison tab, which allows you to see a summary of differences between updates – condensed into an east-to-understand report format.
Let’s talk performance
The new Performance Trending component allows you to select any Activity Code type and chart its performance through each schedule update. Save your selections for easy reference the next time you visit the project.
New driving path component
We’ve added the Driving Path Analysis component to the Schedules—Analysis tab. With this component, you can view the driving path to any interim milestone or activity. Just make your selection, and the path will be calculated in real-time. This data can also be exported to Excel.
Activity start tracking
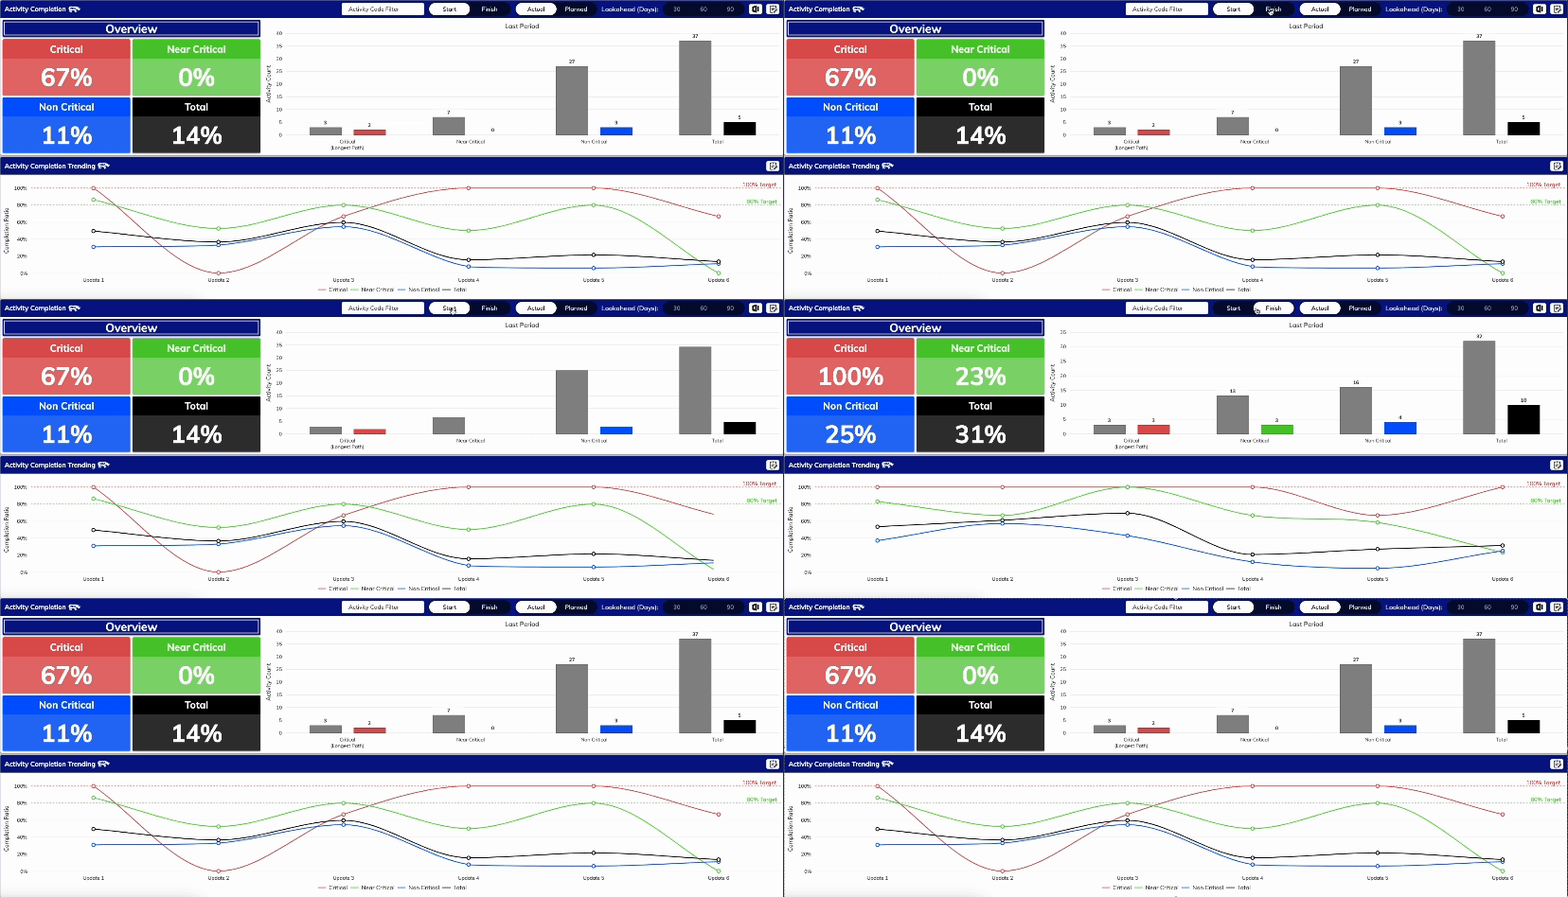
We’ve added a start/finish toggle to the Activity Completion component to allow users to swap between start and finish date tracking. This selection also updates the trending chart below, to show historical activity start percentages for each update.
Customizable overview tab
You can now edit the Overview tab to include only the components relevant to your project/team. Manage the overview components in Overview tab in the Project Settings window. 
All components now have individual note sections. Click the notes button to add new notes or view notes from previous updates. All components will also display their current notes in the Overview tab PDF export.

A place for all your reports – Reports center
We have created a new report center that allows you to manage your report templates, batch-export entire reports folders, and receive PDF report packages via email.
Continued optimization
We’ve improved how data is fetched and moved certain computations to the front end. This increases the number of devices we can support and enhances the application’s general performance.
We are excited for you to try the new features – current users can get started today at https://dashboards.consultaegis.com. If you think Aegis Analytics can boost your team’s performance, contact us for a demo at newopps@consultaegis.com
