What’s new?
- Cost tracking is finally integrated into Analytics, with budgets, completion costs, and historic performances all ready to view!
- New tabs for tracking cost, schedule analysis metrics, reporting, and an overhauled overview tab allow for easy access to the most important data
- Unlimited milestone tracking! The milestone component is no longer restricted to five milestones
- All pages in the project view can now be exported to PDF from the project menu, replacing the executive report
- The portfolio page layout can be modified, saved, and swapped to your heart’s content. We also included a new Gantt view for visual feedback on your portfolio’s health and status!
Bust out the party hats and get ready for the bash; let’s open up the presents and see what we have to celebrate with!
Cost tracking, welcome to the party!
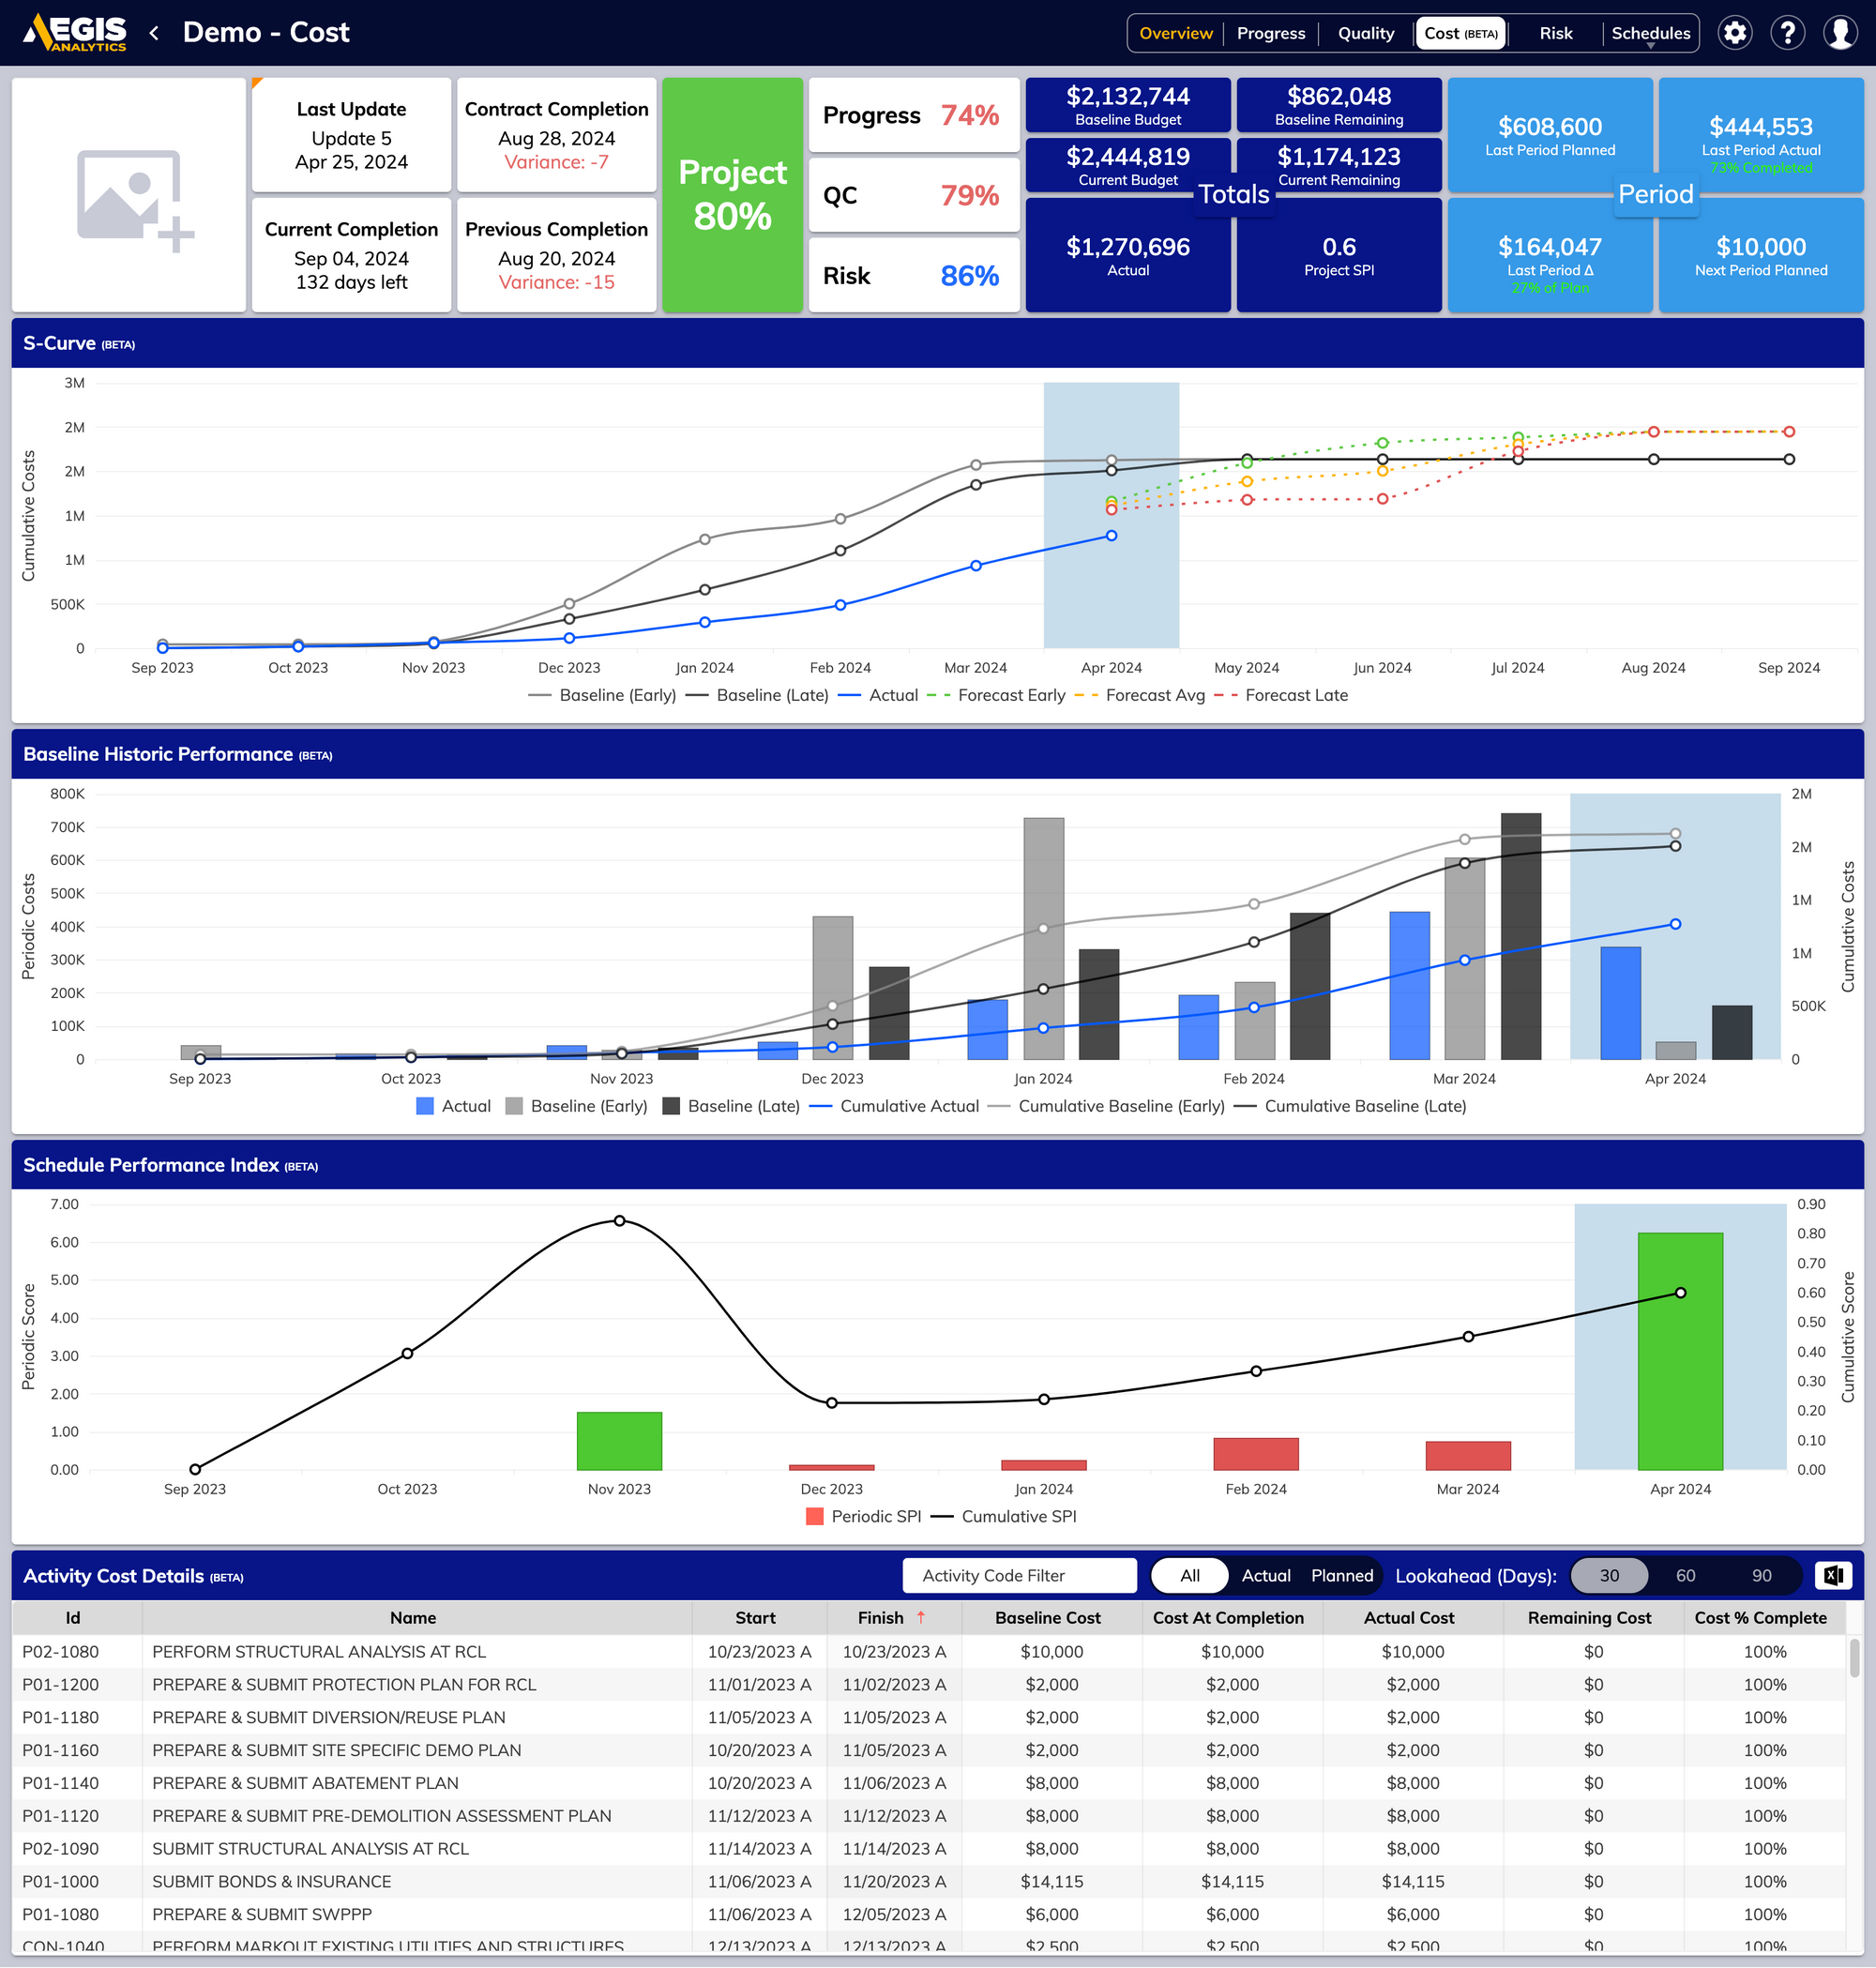
We are introducing our newest feature: cost tracking! Using our innovative new tab and components (beta), you can take costs from your schedule and plot and track your project’s planned, current, and at-completion costs. They certainly know how to make an entrance!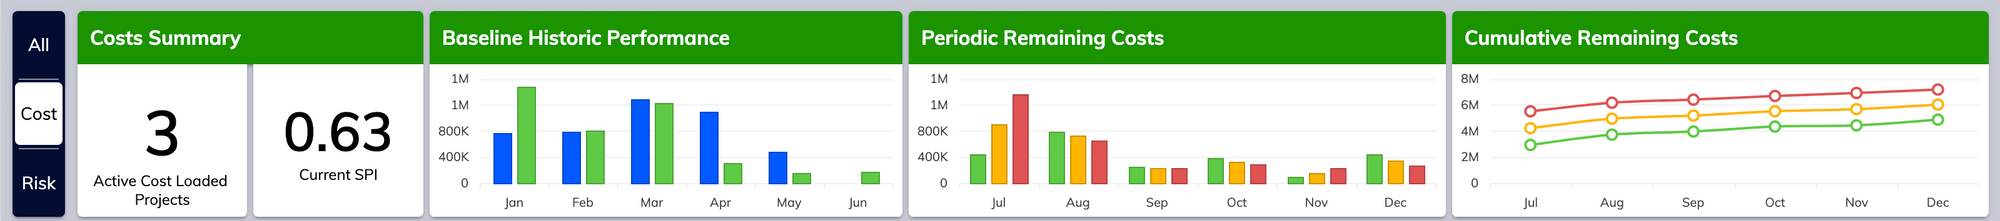
We’ve also added a new banner on the portfolio page, allowing you to filter for all cost loaded projects, and review past performance, as well as your portfolio’s upcoming costs.
Put it on our tabs.
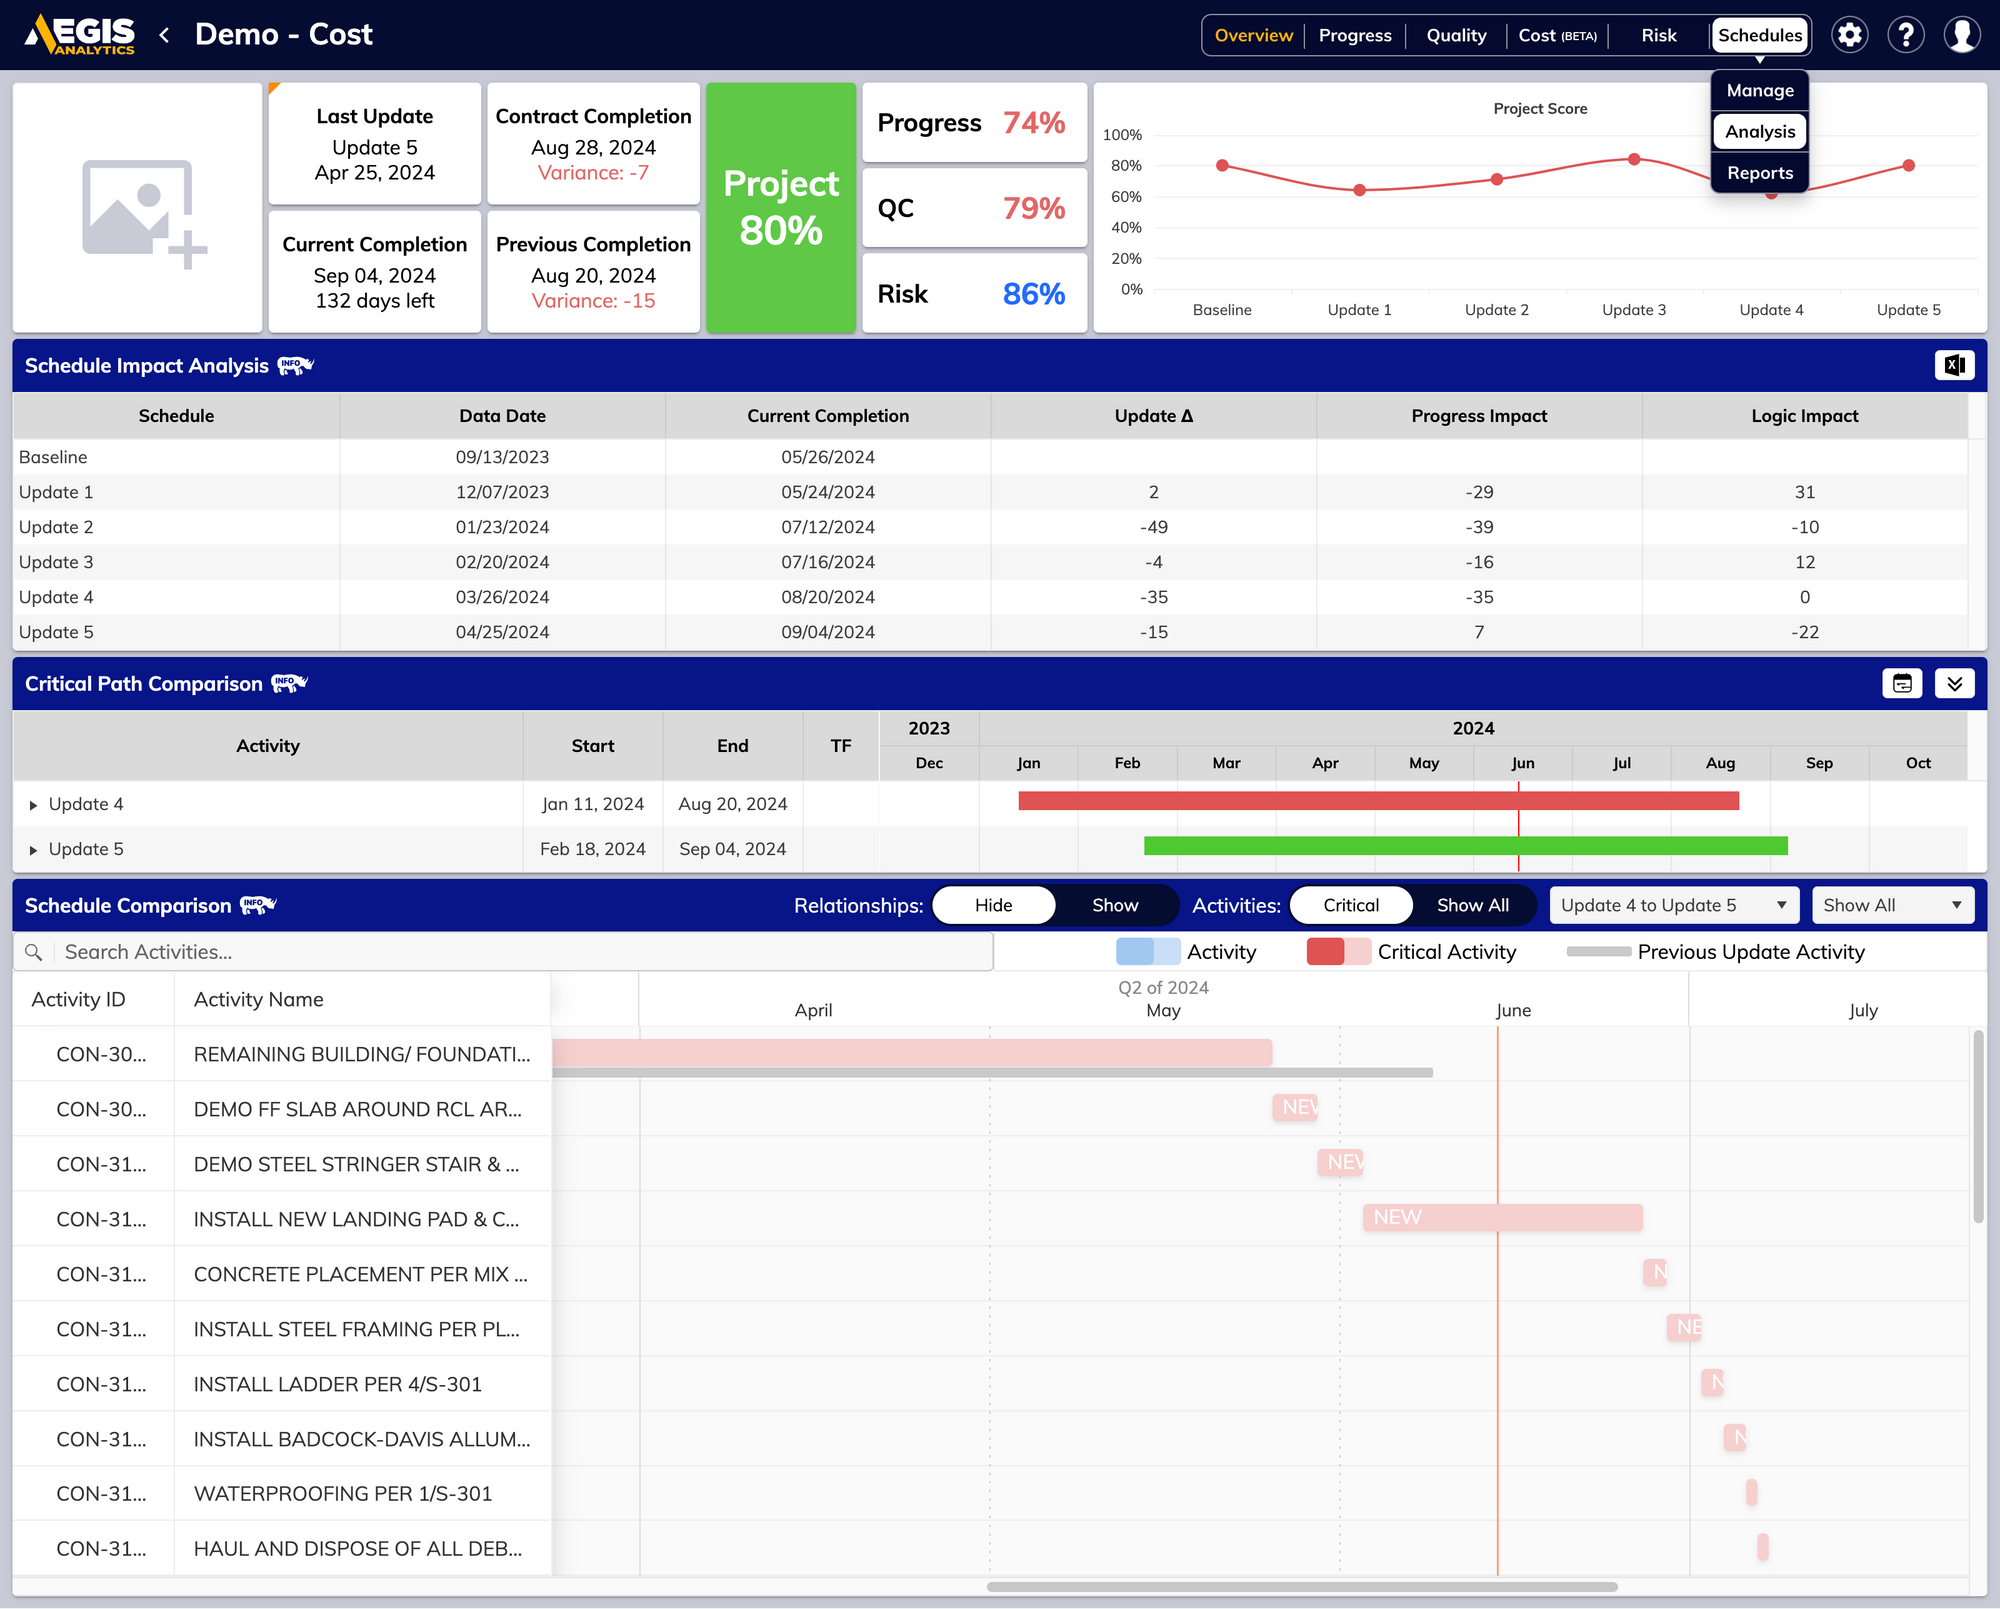
We are introducing not one but three new tabs! Not only are we introducing our new cost tab (beta), but our new analysis tab contains your schedule comparison tools and a new schedule impact analysis component that identifies progress and logic change impacts in your schedules!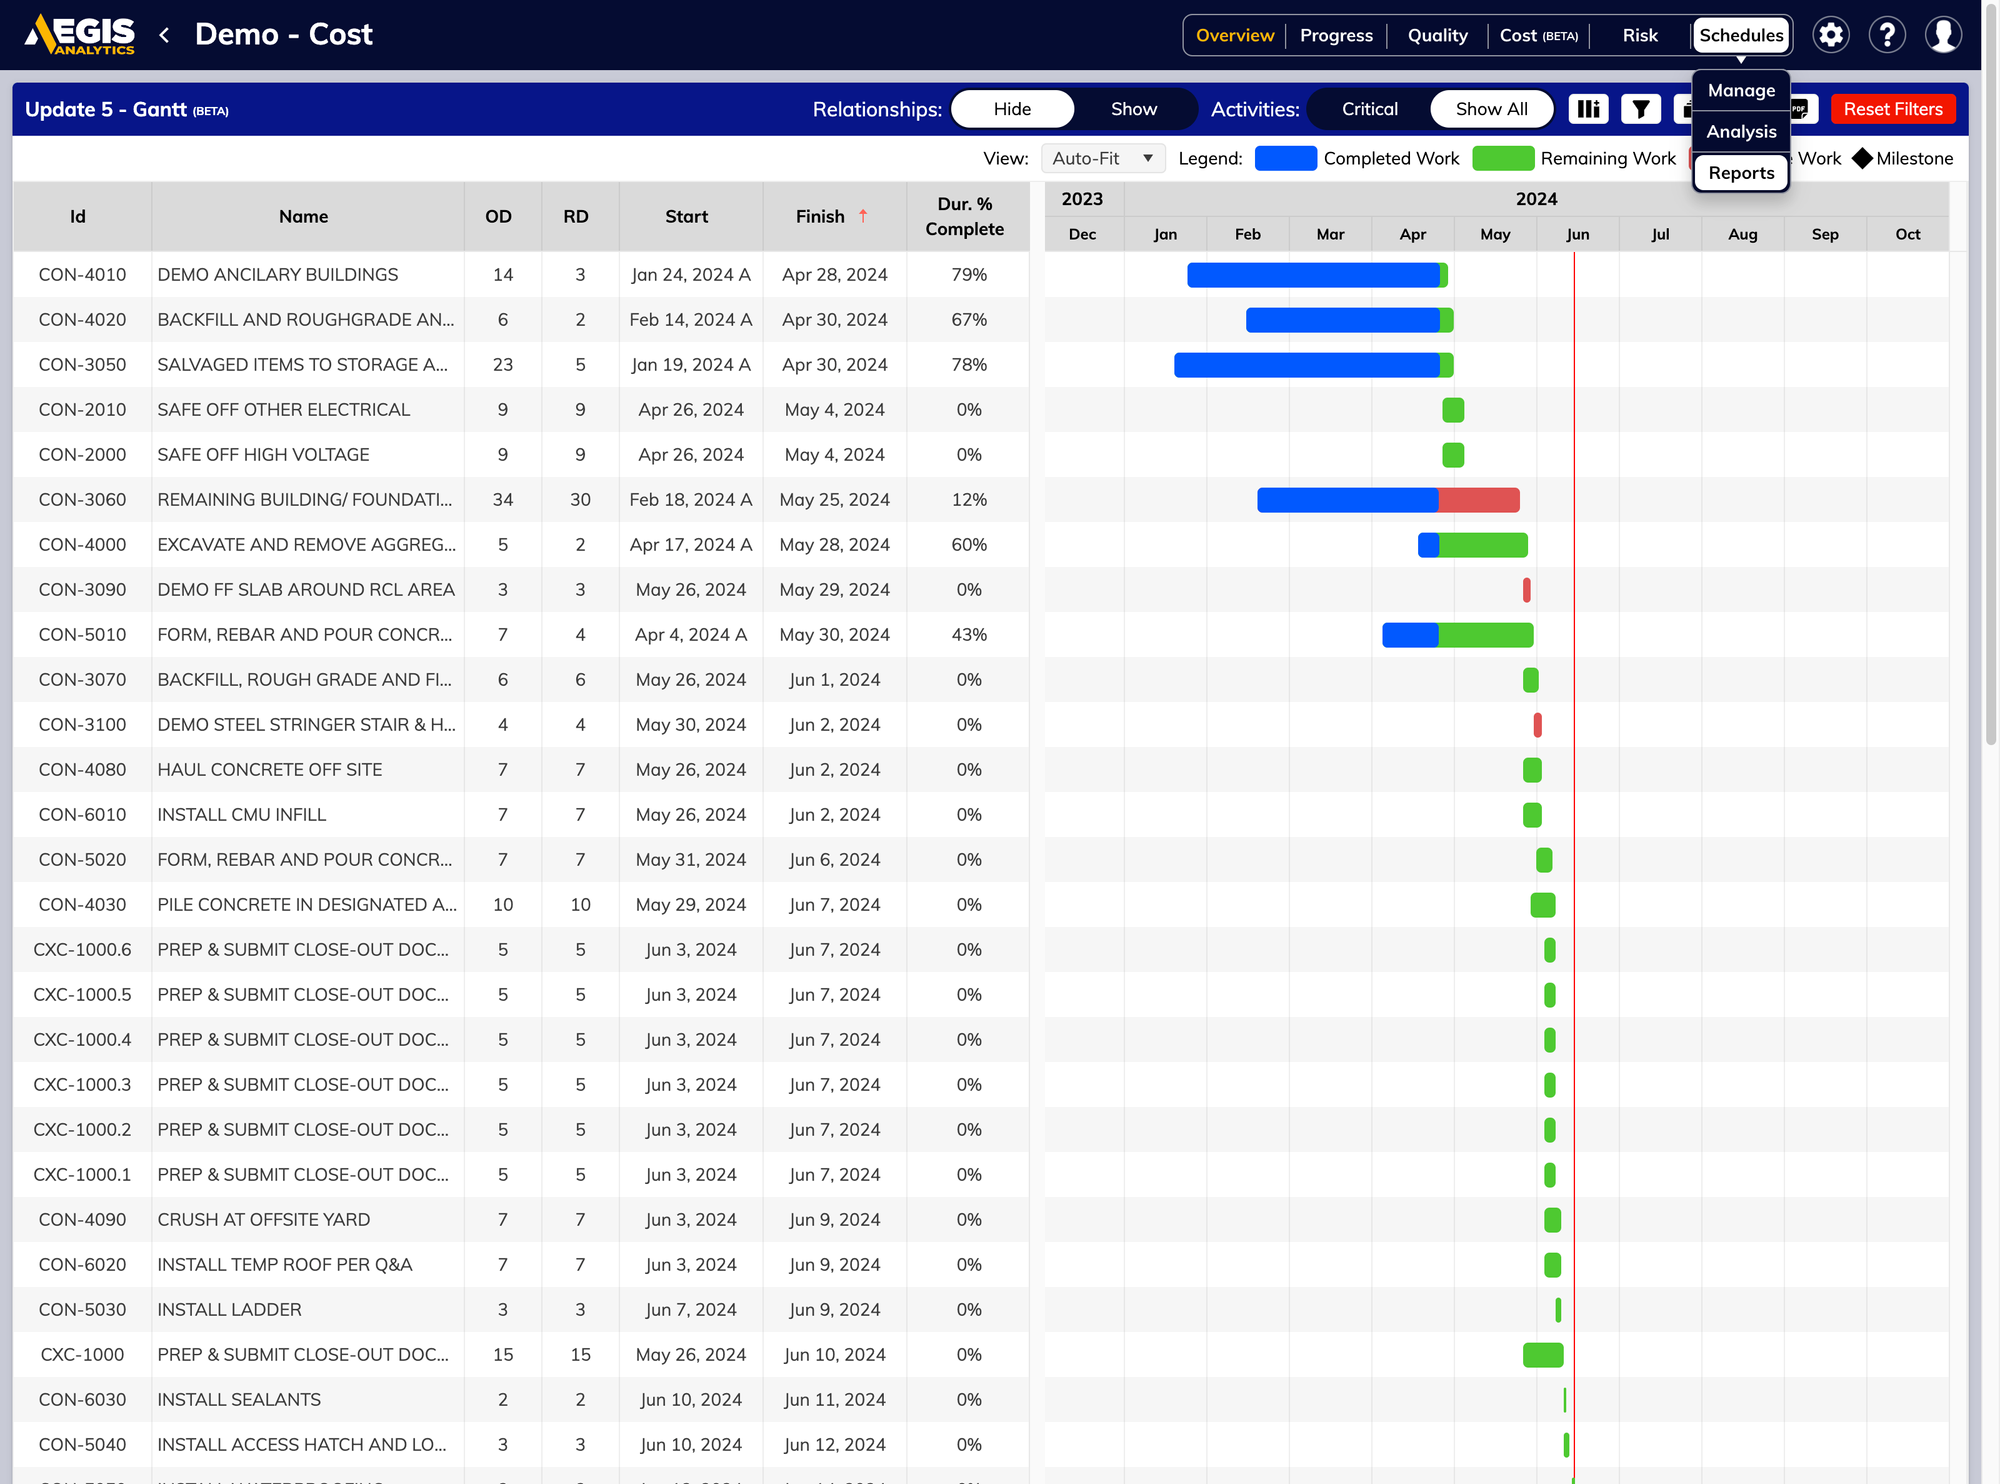
Finally, the reports tab provides access to your entire schedule in a Gantt chart, allowing you to filter, group, and export your reports, all without having to open P6! Our analysis and reporting components will be expanded on in a future release.
Take milestone tracking to the next level.
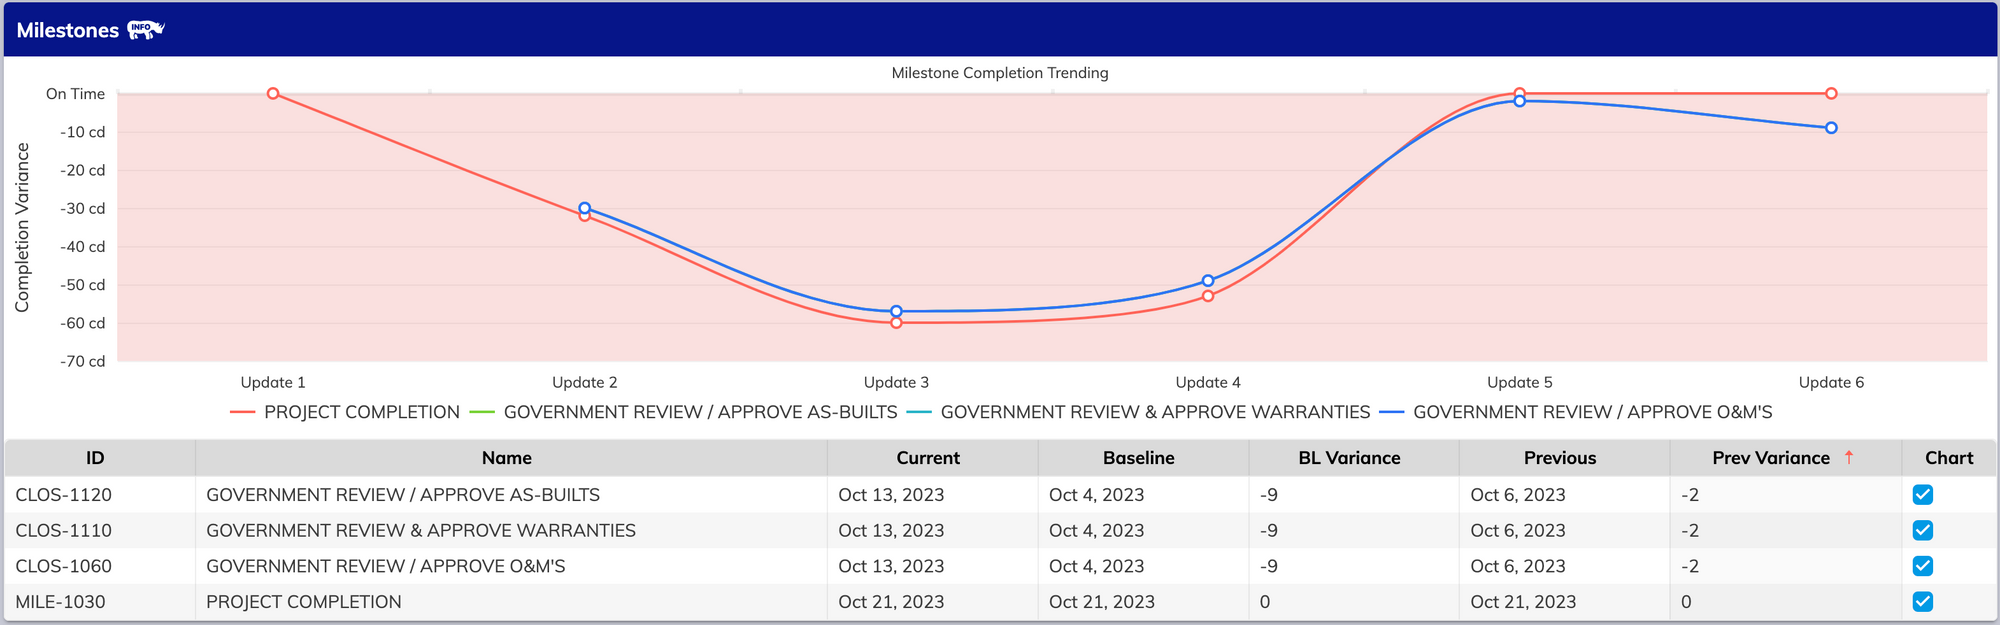
Due to processing constraints, Aegis Analytics has had a 5-milestone limit for through-tracking during a project’s lifecycle until now. Our crack team of engineers has broken through this limitation and given us the green light to announce that you can now track to your heart’s content! Do you have a milestone that you want to add, remove, or change? No problem. We now have a tab for editing tracked milestones at any time in the project admin window.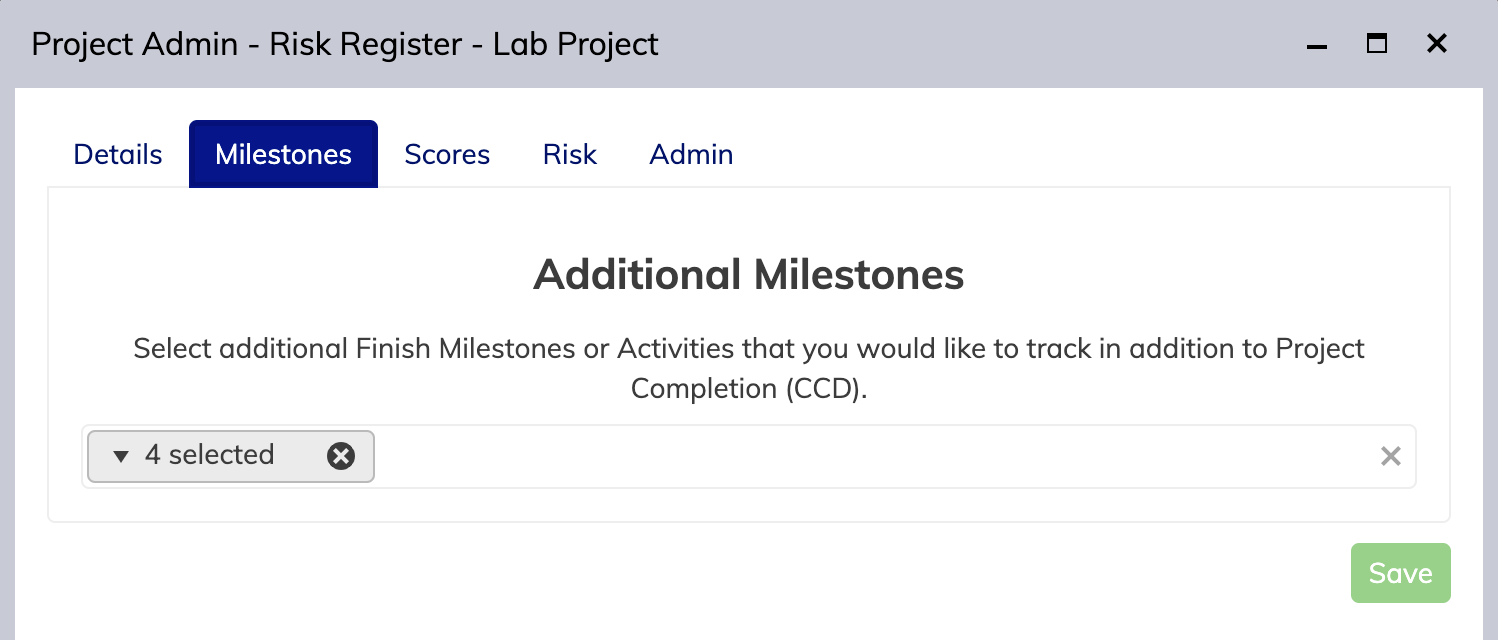
Like what you see? Export it.
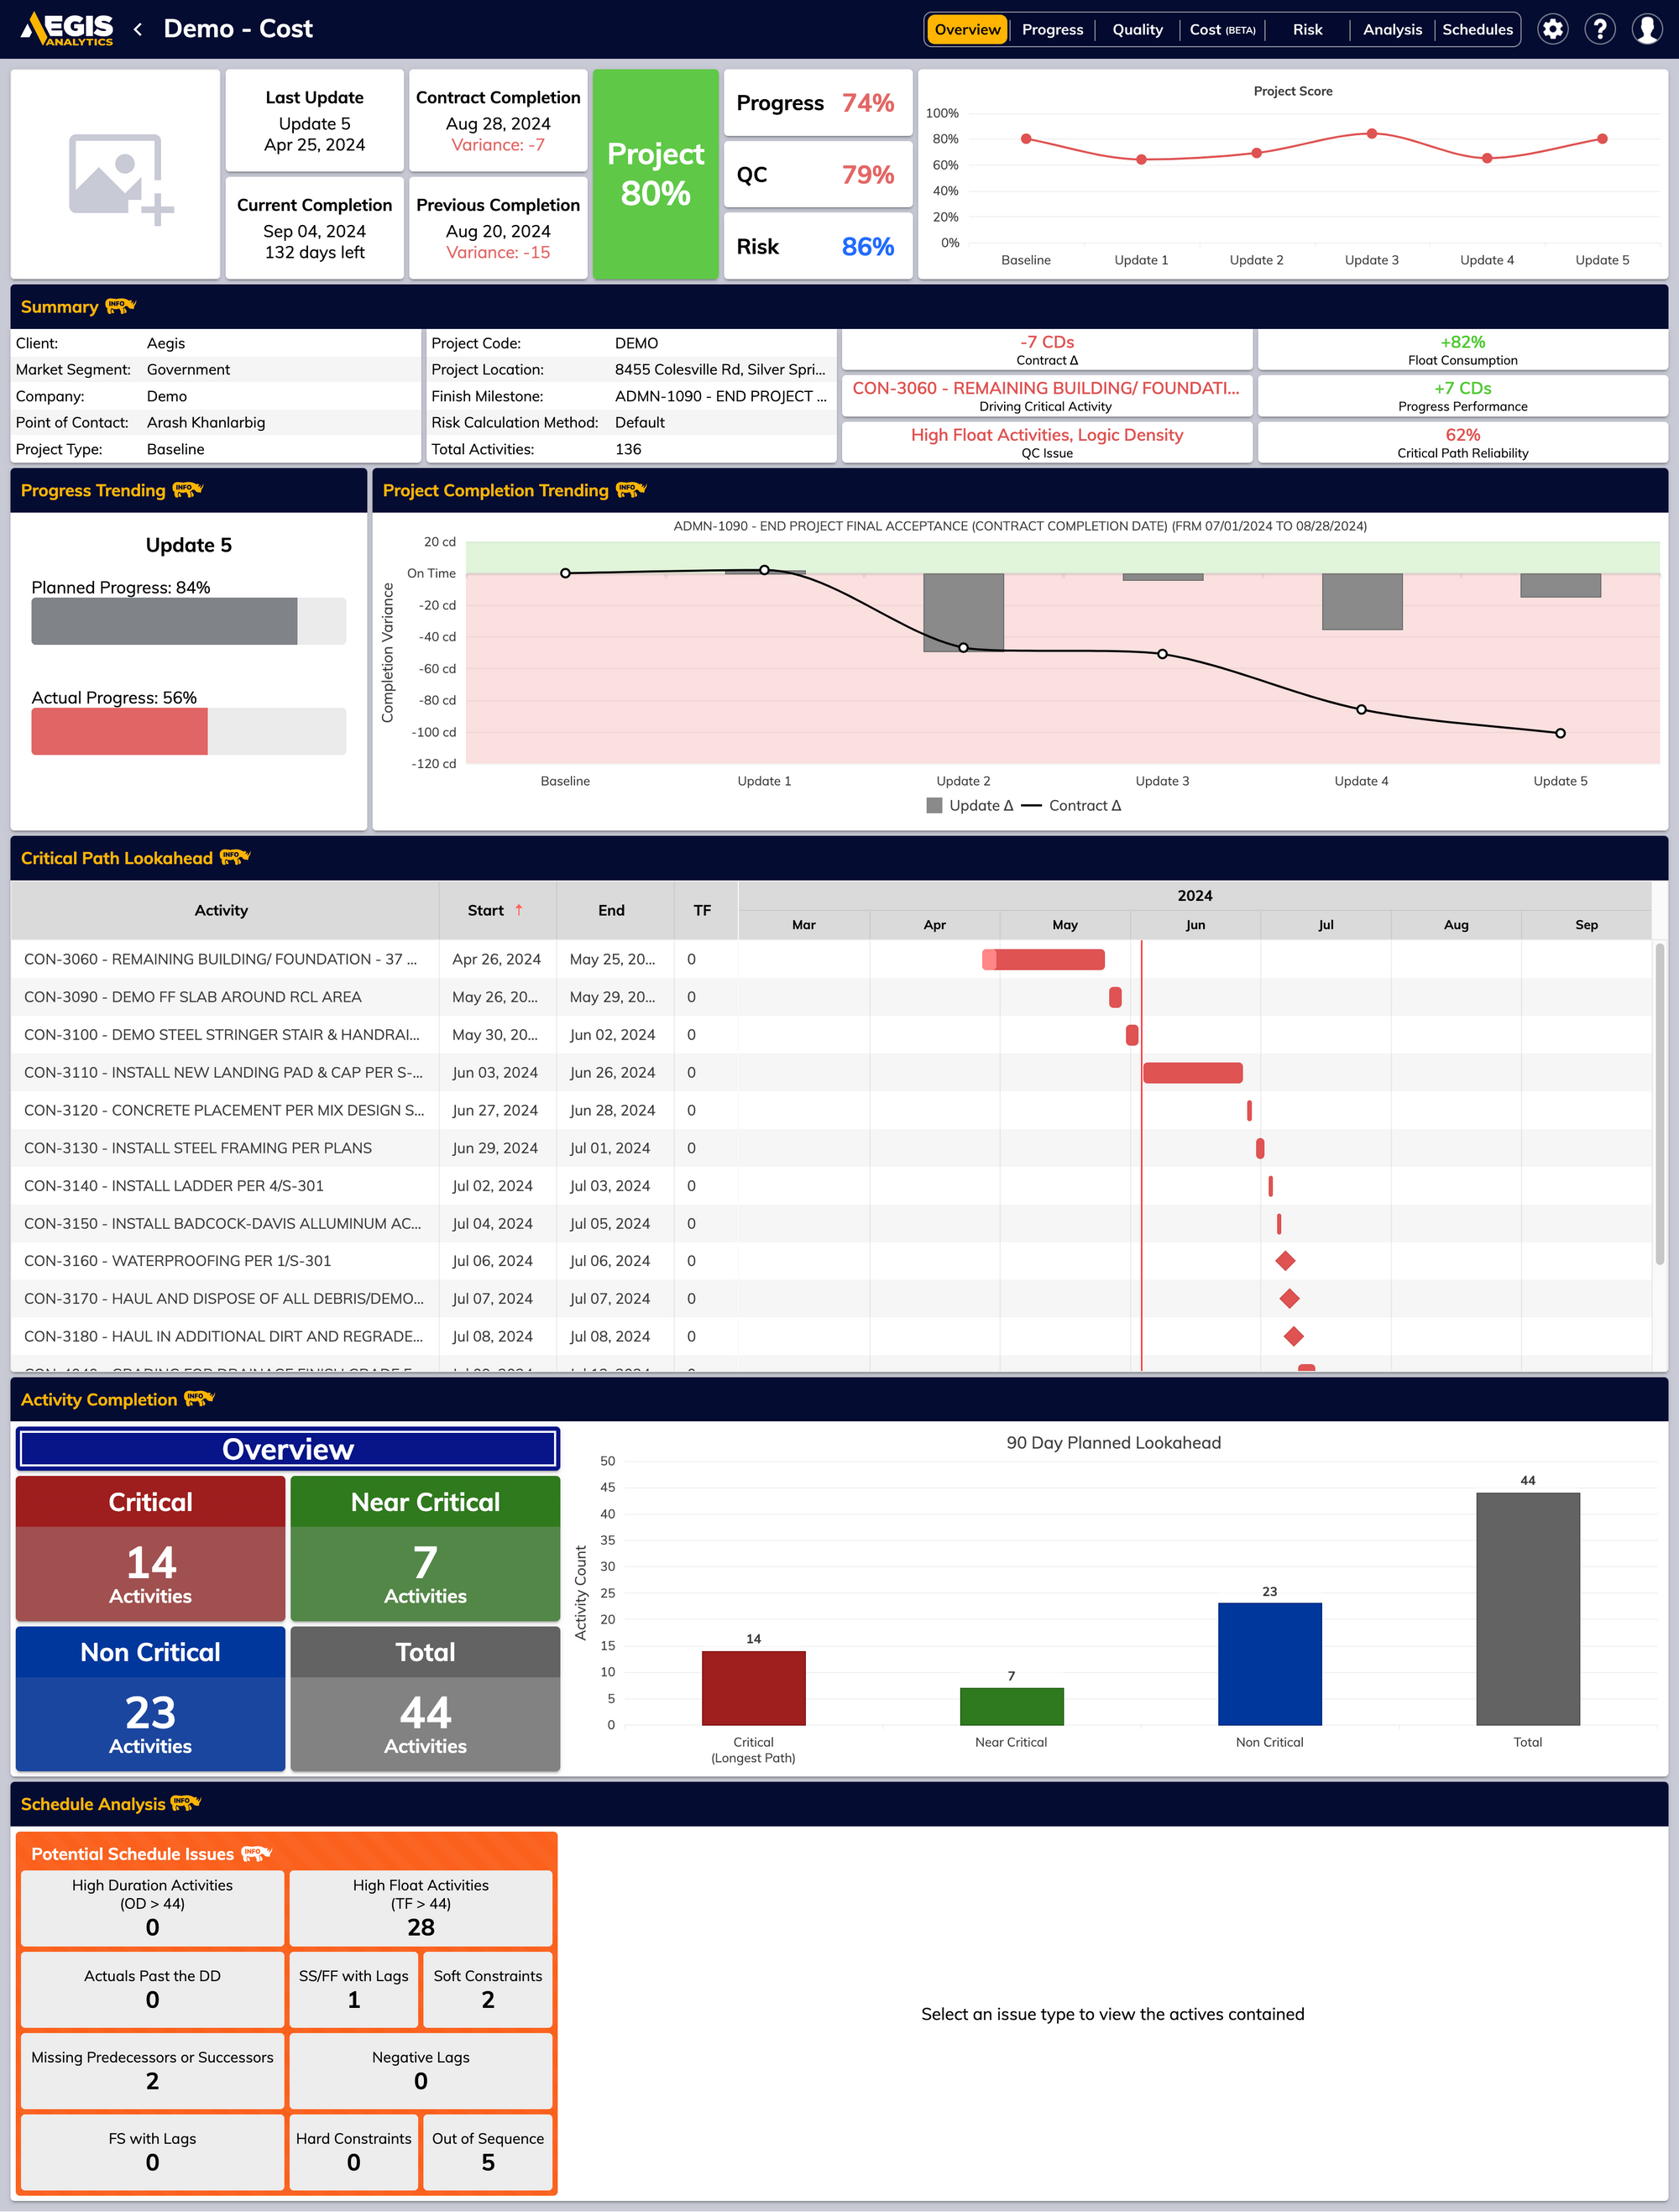
Instead of the old executive summary, all pages can now be exported directly into PDFs. Downloading and sharing tabs in your project has never been easier. We also overhauled our overview tab design to show you the most important high-level information.
No party is complete without a bit of dress-up. Check out our portfolio view glow-up.
We’ve massively overhauled our portfolio page, adding features that we hope will make using Analytics more engaging and useful.
Portfolio page – project list gantt view
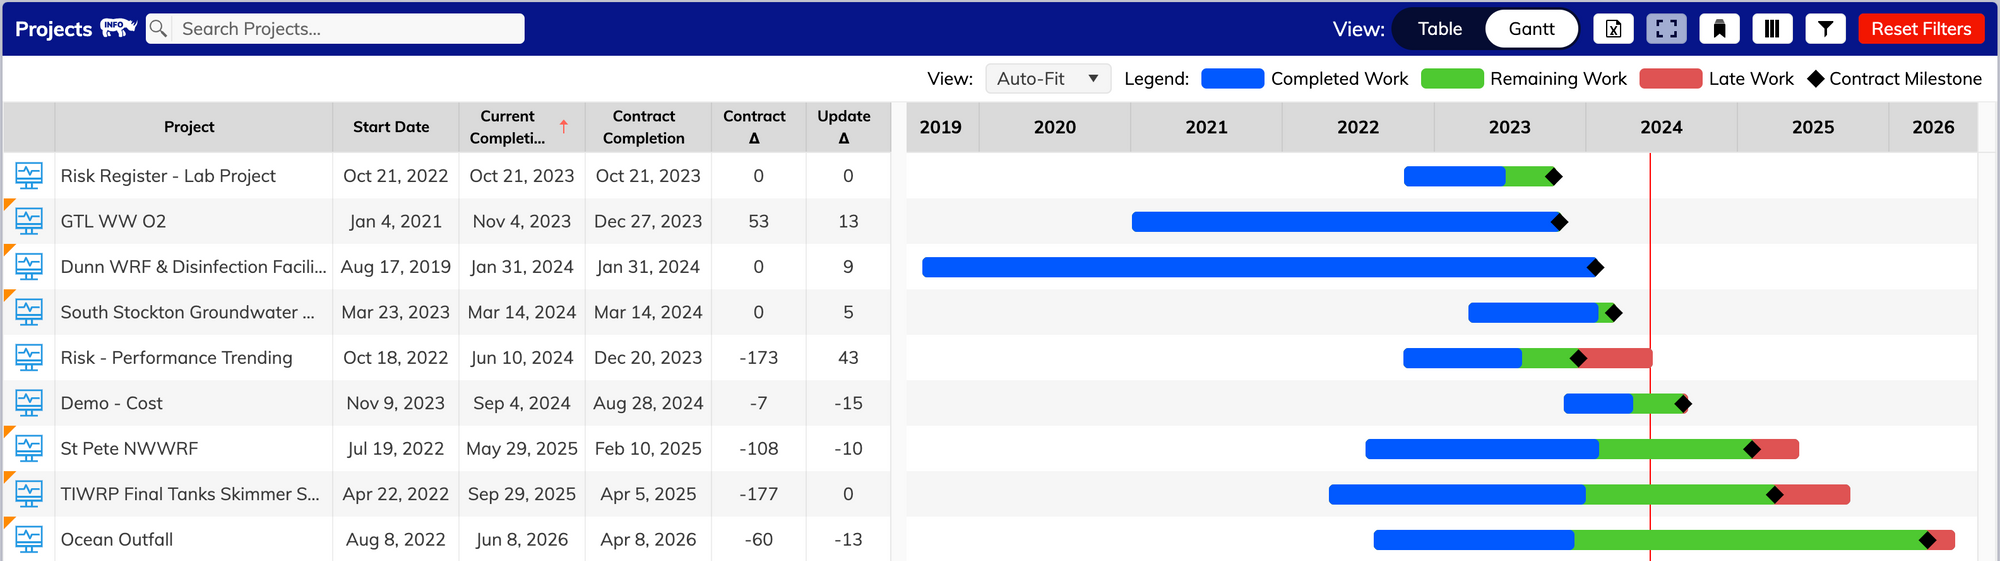
We’ve added a Gantt view to our project listing view types so you can get visual feedback on project progress without doing the math yourself.
Portfolio page – column selector
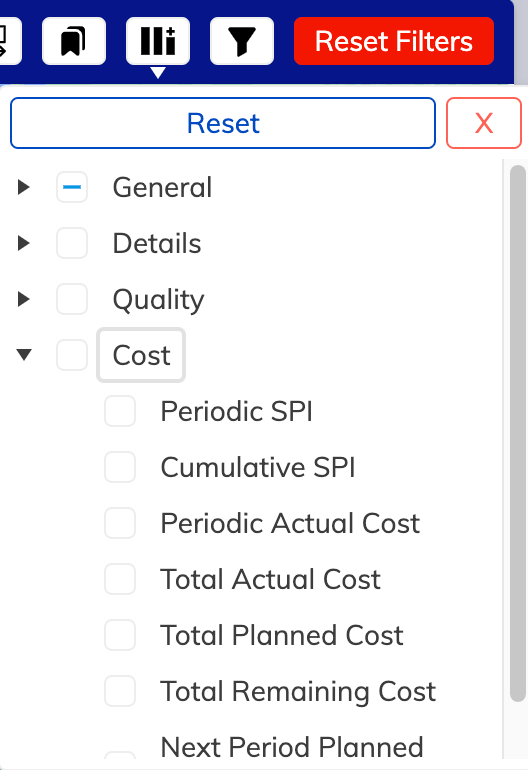
We’ve added a column selector to the portfolio page project list, allowing you to focus on the data that is important to your projects!
Portfolio page – layouts
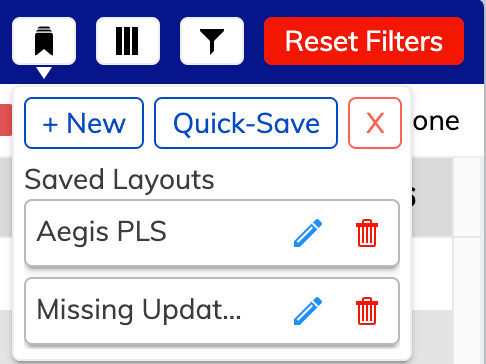

We’ve given you complete control over managing your layout in Analytics. You can save your preferred filters, banner, project list view, and data columns. Create several different layout options depending on what you want to see. This is all saved to your account so you can access your favorite views from wherever you are!
Break out the party favors!
We have so much we want to highlight, and no party would be complete without party favors:
- Loading speed improvements—We’ve drastically changed how data is fetched from our backend, which has resulted in an overall increase in speed across the application.
- Large project optimizations and performance improvements—We’ve examined how megaproject schedules are analyzed in our report generator and made some important tweaks and process improvements to speed up performance and reliability!
- UI cleanup and clarity—In this release, we spent a lot of time reviewing our application and making the user experience more friendly and cohesive. This also included a complete upgrade of our front-end engine to make things snappier and more responsive.
We think this party will be one to remember, and you’re invited! To get started using our v5.0 update, visit https://dashboards.consultaegis.com now!